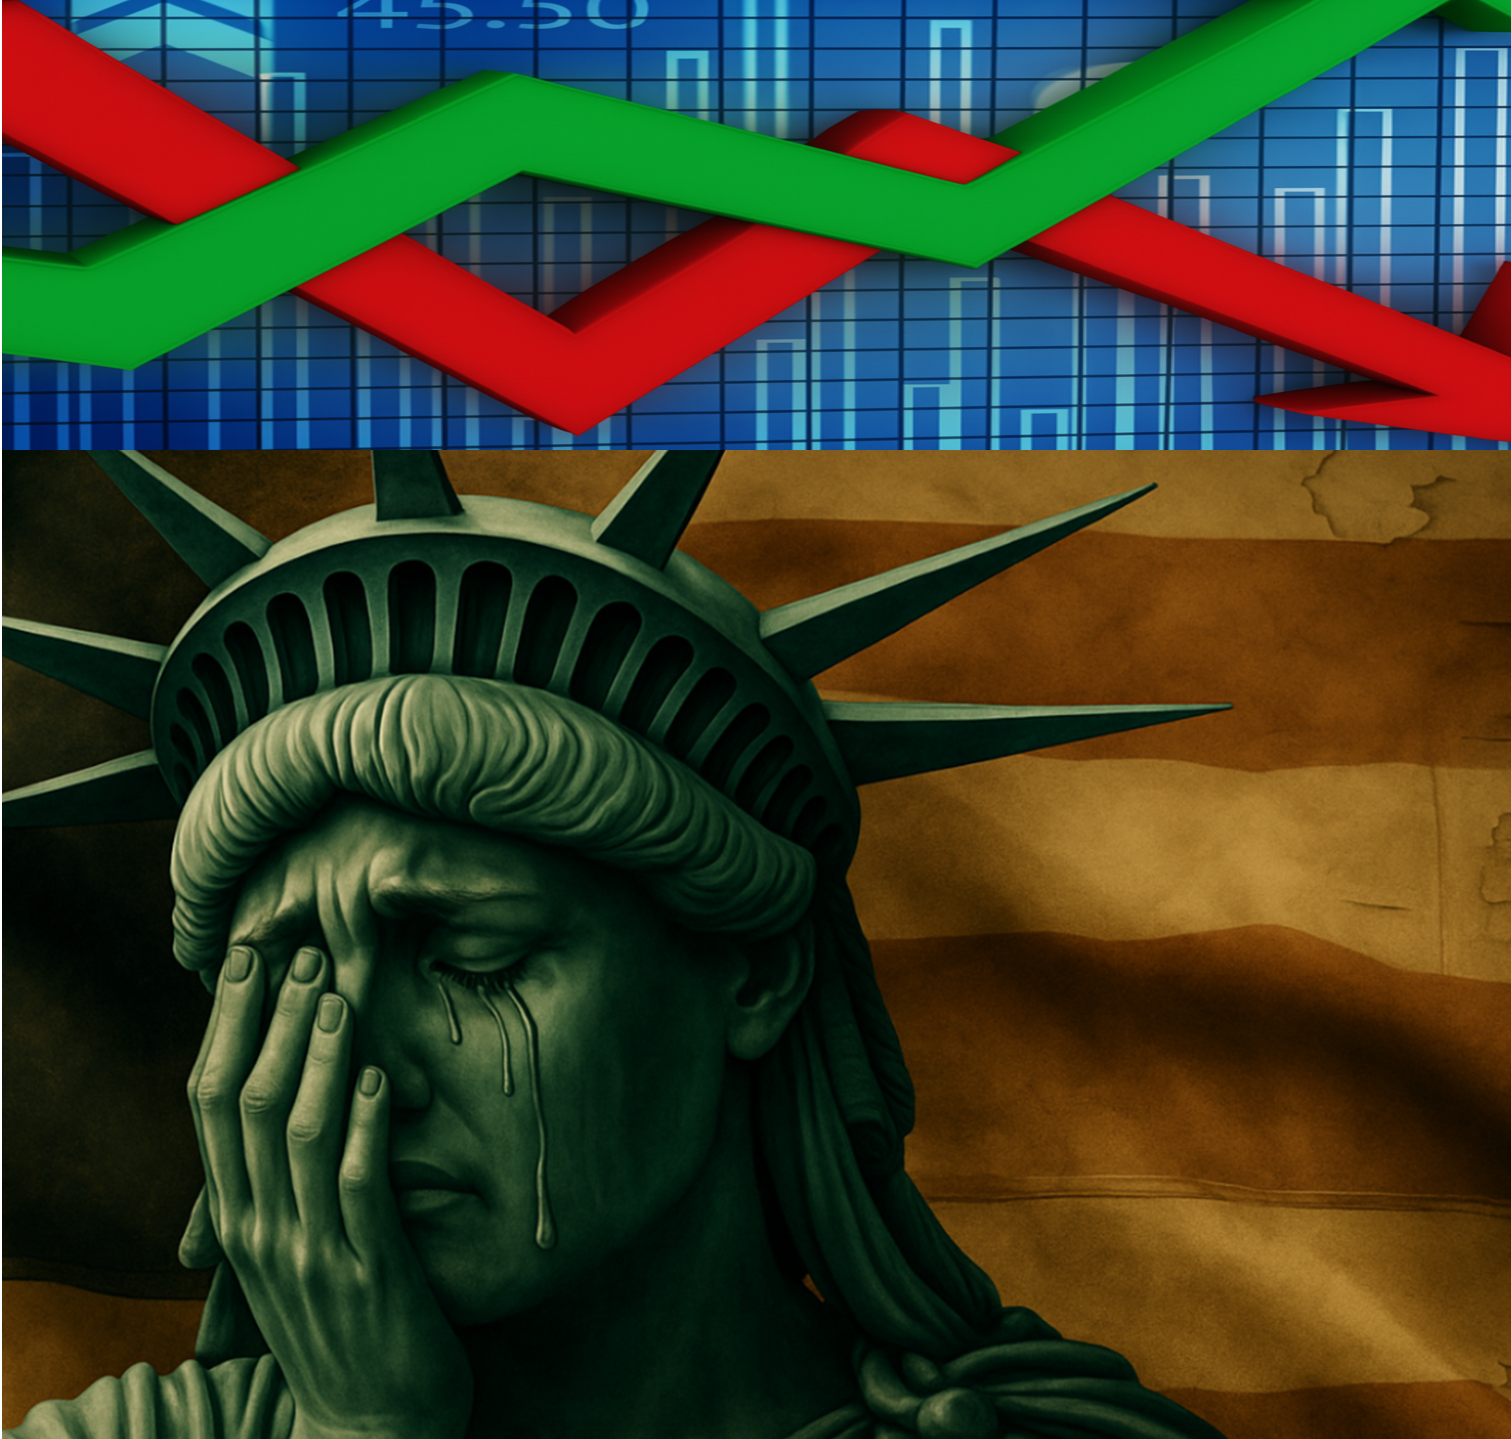
Financial Market Forecasts
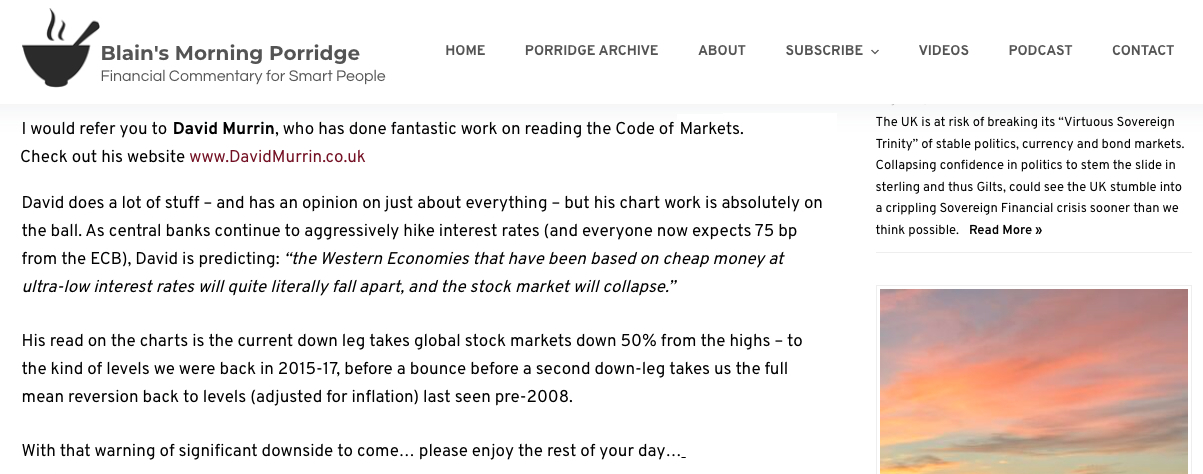
I have known David since 1988 when I headed Sterling Eurobond trading at JPMorgan in London. David was then and remains a polymath whose fascination and study of behavioural patterns is prescient. His track record, available on his website Quarterly performance appraisals, reveals his accuracy in pinpointing entry and exit points for his lateral views of markets, geopolitical events and human behaviour. Following his initial success as one of the first proprietary traders at JPM, David was asked to set up and run a price-based market analysis group. This was an innovative and bold move for a traditional and highly conservative operation. What impressed me most about David was his independent and lateral analysis. Never one to be carried along by the crowd David saw patterns that others did not which were portents of market moves. My interactions with David at JPM led to a long and enduring relationship with him that continues nearly 35 years later. During that time I have watched him develop and improve his market behavioural models to their current form. Whilst no market predictor will ever be right one hundred per cent of the time David's consistency and his risk-reward approach as revealed in his audited results, are compelling. The precision of his entry points for trades which provide low-risk trading opportunities are reflected in his quarterly published trading results. His insights are extremely valuable and alpha generative, across not only the main market sectors but individual shares. Whether your interest is in predicting market movements, geopolitical events or behavioural modelling David’s book Breaking the Code of History was and continues to be groundbreaking and has inspired many coming after him to explore David’s compelling analysis.
Dominic Price is a veteran banker who worked for JPMorgan for over 25 years including in several senior roles in Asia and was a subsequently a Senior Advisor to JPMorgan. (January 2023.)
David, your fully integrated work combining global geopolitical historical perspective, overlaid with a keen understanding of the inner working of financial markets, provides a level of wisdom that is rare. The quality and depth of research is invaluable to leaders across the political, corporate and investment disciplines.
Satish Rai - Chief Investment Officer OMERS Pension Fund Canada
David Murrin is an amazing geopolitical and macro thinker. He was my consultant while I was at Exoduspoint and one of the few non-linear thinkers who could provide real alpha.
Antonio Fortes Senior PM
I have known David for over five years and, during that time (all documented) he has predicted the rise of Trump, every twist and turn during the three-year course of Brexit, including Boris becoming PM (a year before he did), and the landslide election result.
Rob Hersov - Chairman of Invest Africa
On January 30th he called me and really panicked me (I have all the WhatsApp’s to prove it), which made me dump most of our family equity portfolio and move into cash. He has saved us a large fortune!
When no one was looking, in early January, he warned that the Wuhan Flu was going to become a pandemic that would bring the global economy to a dead stop. Simultaneously he predicted the drop of oil from $65 to sub$27 and the collapse of the stock markets. All these predictions were in papers he wrote, and speeches he gave (some at my Invest Africa events), and most people then thought him mad. How silly (and poor) they look now.
Bill Blain - Investment banker and market commentator
I will state from the outset that I generally shun predictions and, by extension, am suspicious of those that claim to see the future. Nonetheless, while David refers to “predictions” on his website, I believe that these are better described as an interpretation of geopolitical conditions through the prism of his Stages of Empire theory. This has enabled David to consistently make seemingly outlandish but remarkably accurate interpretations of current events and, by extension, market calls. Given his interpretative framework, I see no reason why David’s analysis should not remain as consistently accurate for many years to come.
Andy Pfaff - Chief Investment Officer | Coherent Commodity Investment (Pty) Ltd
Many thanks for your Valuable advice on positioning in different asset classes.
Prakash Shirke - CFA Investment Adviser
Recalling our meeting at a Hannam and Partners dinner and subsequent lunch, I have regarded you as something of a sage as you predicted both the Trump victory and Brexit referendum as well as the market meltdown which we have witnessed over the past week or so.
John Battersby - Director of the South African Chamber of Commerce consultant/journalist/author
Several years ago I had the fortune of meeting David Murrin through Rob Hersov. David captured his audience with his candid dialogue, no frill content and a wit that equaled his exceptional insights. His ability to leverage off historical context and provide relevance to the current global political arena had his audience spellbound. I would recommend David as both a speaker or VIP dinner guest at any table.
Ariella Kuper - CEO Solution Strategists Pty Ltd
I don’t know enough about charting to make much of it myself, but I’ve seen enough to recognize the repetitive nature of market-driven behaviour. Market patterns do repeat and are therefore worth paying attention to. For instance, for a superb overview, take a look at David Murrin’s website. His global forecasts and commentary is worth a sign up to run through his chart-supported outlook and reading of the underlying forces at play
Bill Blain - Morning Porridge and Shard Capital
David Murrin is a long time friend as well as a very special investor. He brings to the 21st century an enormous amount of experience as well as knowledge. We live in a very difficult environment. He is in invaluable.
Johnathan Smith Founder - Chesapeake Asset Management
David Murrin is one of the best global macro forecasters I know, do sign up for his newsletter… ...he is an outstanding human and one of my favourite people in this industry
Anric Blatt Managing Partner - involved with hedge funds and the #FinancialPlanning community since 1994, has done due diligence on 15,000+ funds and has been an investor in thousands of them
You were spot on your forecast of the Tory majority when I spoke with you 2 months before the November election. You were spot on with your forecast months before the Covid-19 pandemic of what impact it would have on the global economy and I did not believe you ! You have been spot on with gold and commodity prices.
As you know, I tend to always look on the bright side of life and try and believe that disasters will be averted but this pandemic and the global economic partial paralysis is an event which I never thought I would experience in my lifetime and clearly will have disastrous economic ramifications for the medium term.
Retrospection can teach us all lessons but the accurate vision for the future is a rare talent.
Lord St. John Anthony - 22nd Baron St John of Bletso is a British peer, politician, businessman and solicitor
Quite often, those of us continuously trading in the markets tend to get lost in the noise and pay less attention to the major geopolitical issues that will shape the global economy for years to come. These geopolitical transformations are happening now. David is there to help you bring these issues into focus and help you think outside the box. We've had numerous in-depth discussions on how these transformations will impact not only our portfolios but our lives in general.
Antonino Fortes Senior Portfollio manager
Who is this for?
This service is for:
- Banks
- Pension Funds
- Resource and commodity companies
- Hedge Funds (Macro and Long/short)
- Corporate Treasuries
- Family Offices
- HNWIs
What is the basis of David's analysis?
David developed a unique and effective set of behavioural models to predict financial markets, whilst at JPM, which were extremely effective and profitable. They acted as the foundation for his 20-year career as a CIO of his hedge fund Emergent. With some remarkable returns in the most bearish of markets (e.g 84% in 2008 - see track record).
What analysis can I get?
David provides two types of market analysis:
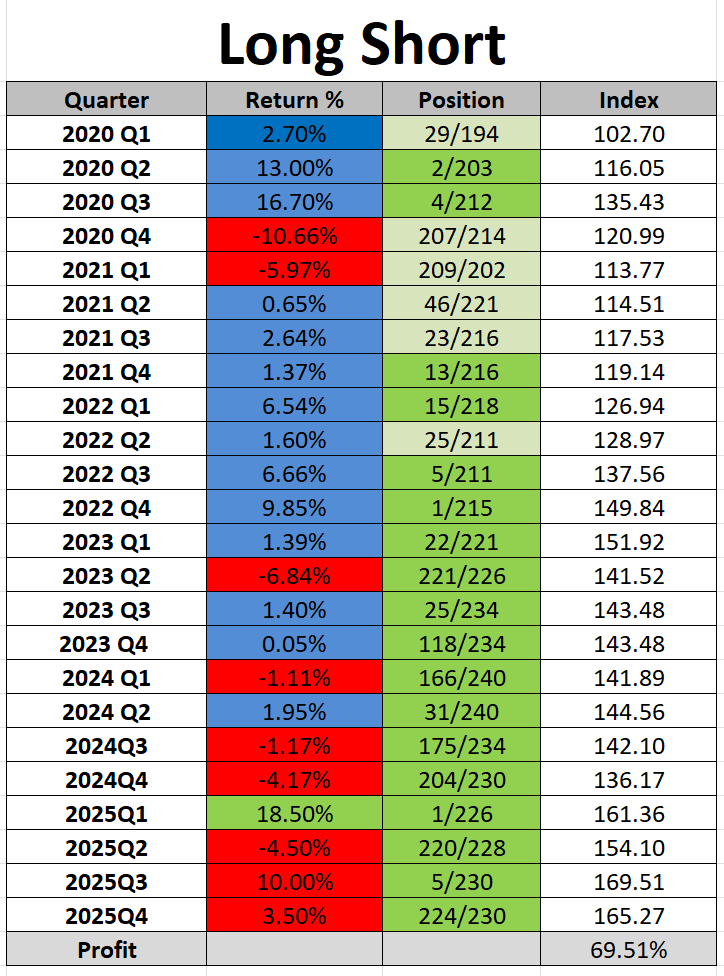
- The CIOs Long–Short View service is designed to provide long-term and medium-term investment outlooks for long-short funds and aims to follow a portfolio of 50 shares from the sectors that we cover.
- The Premium CIOs Long–Short View - this service is designed to provide long-term and medium-term investment outlooks into long and short positions in specific shares specific recommendations in a range of markets.
Do you offer different subscription options?
Yes. David offers a number of different levels of subscription to meet your needs and budget, on a 3 or 12-month basis.
How do I gain access to the analysis?
Once subscribed you can login to the site and view the analysis in a secure area of the site.
Click on the Pricing tab to view the costs and subscribe now.

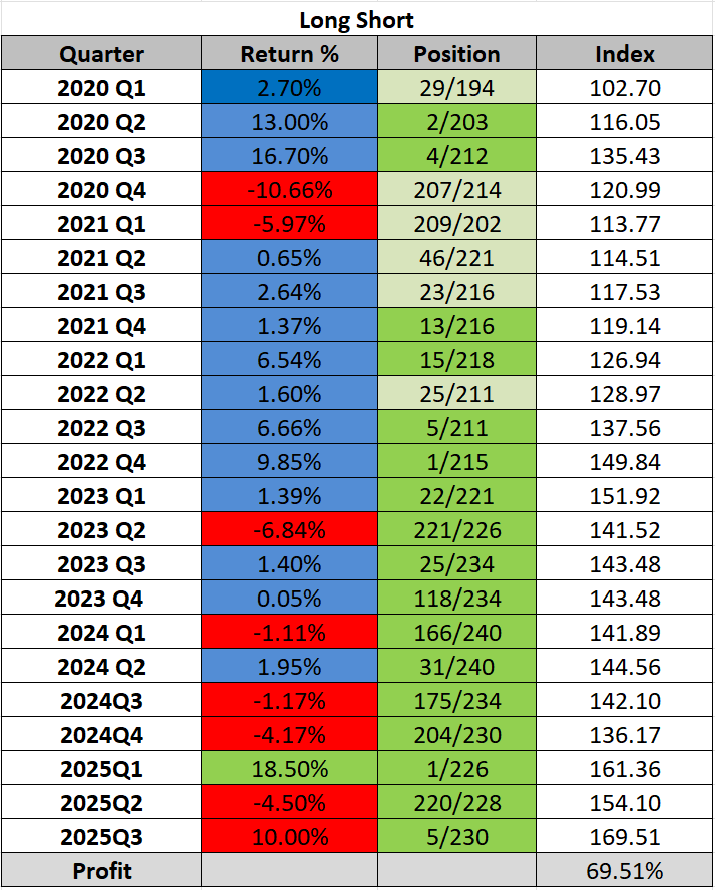
David Murrin has been a macro trader since 1986, first working at JPM on its first Prop desk and then as a founder and CIO of his Macro and Emerging Market Fund, Emergent Asset Management, for over 20 years. During that time he has had a remarkable track record of predicting major market declines and profiting extensively from them. Short at the highs and then running with the decline in the 1998 Asian Crisis, the 2001 dot com bubble, the 2003 Argentine crisis, the 2007 bear market, the flash crash of 2011, last but not least the February 2020 pandemic risk-off crisis. However, his work not only accurately predicts these big dislocations and but also then focuses on the safe periods to then extract risk-off Alpha. Subscribing to Global Forecaster is effectively akin to having access to an outsourced but very experienced CIO, with a uniquely successful track record.
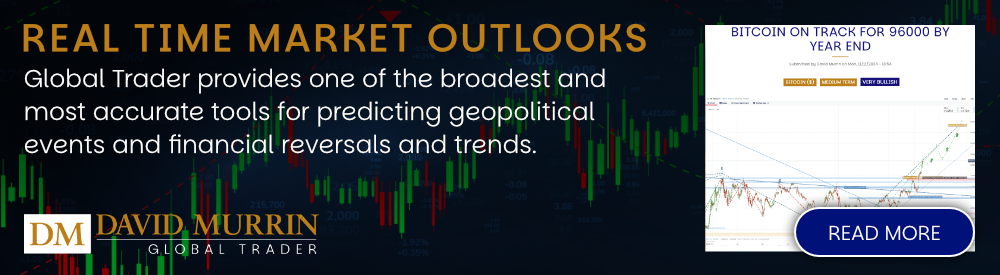
Global Forecaster provides one of the broadest and most accurate tools for predicting geopolitical events and financial reversals and trends. This is achieved by the integration of two unique behavioural models which act as independently long-range search radars, de-risking against shocks and finding low-risk and high-return trading opportunities and strategies to maximise investment returns. Both models are based on the mosaic gathering of multiple elements of information that, when integrated, create remarkably accurate predictions. Our results speak for themselves: our two long-range search radars are based on:
- Our geopolitical predictions are generated from our theories including Dyslexic Strategic Thinking in conjunction with human collective behaviour. The Five-Phase Lifecycle, the Polarisation Process, Dyslexic Strategic Thinking and the Commodity K cycles allow us to predict national behaviours such as the path of the Brexit process, the path of American decline and the aggressive rise of China in considerable detail. These models have allowed us to predict every UK and US election result accurately for the past 20 years and accompanying foreign policy changes and focuses. Having built a baseline of global geopolitics, we can quickly detect new factors that will have profound impacts on geopolitical and financial markets, e.g. on 5th January 2020, we accurately predicted that the Wuhan epidemic would become a global pandemic. Most of all, our model allows us to look at the impact of cycles that have a longer wavelength that can be detected in the price history of modern financial markets, such as the decline of the Western Christian Super Empire.
- Our pattern recognition models are applied across the whole global market complex. Global Forecaster uses a probabilistic pattern recognition system which is applied to over 67 markets. This includes 23 Equity indices, 22 FX pairs, 6 bond markets, and 16 commodity markets, and also over 100 individual shares. Our Wave counts are in effect a language to describe market behaviour by identifying patterns over multiple timeframes, to locate reversal points that then unfold into longer-term trends, providing multiple risk-return profiles. Each market is then correlated to others in their sector, to confirm the pattern quality, and then sectors are compared to other sectors to create integrated roadmap scenarios that give further certainty to our predictions.
Having constructed a clear image of the expectations of markets, we apply our fire control radar to apply specific risk recommendations across specific sectors and markets that can be combined into effective portfolios for Alpha-generating strategies.
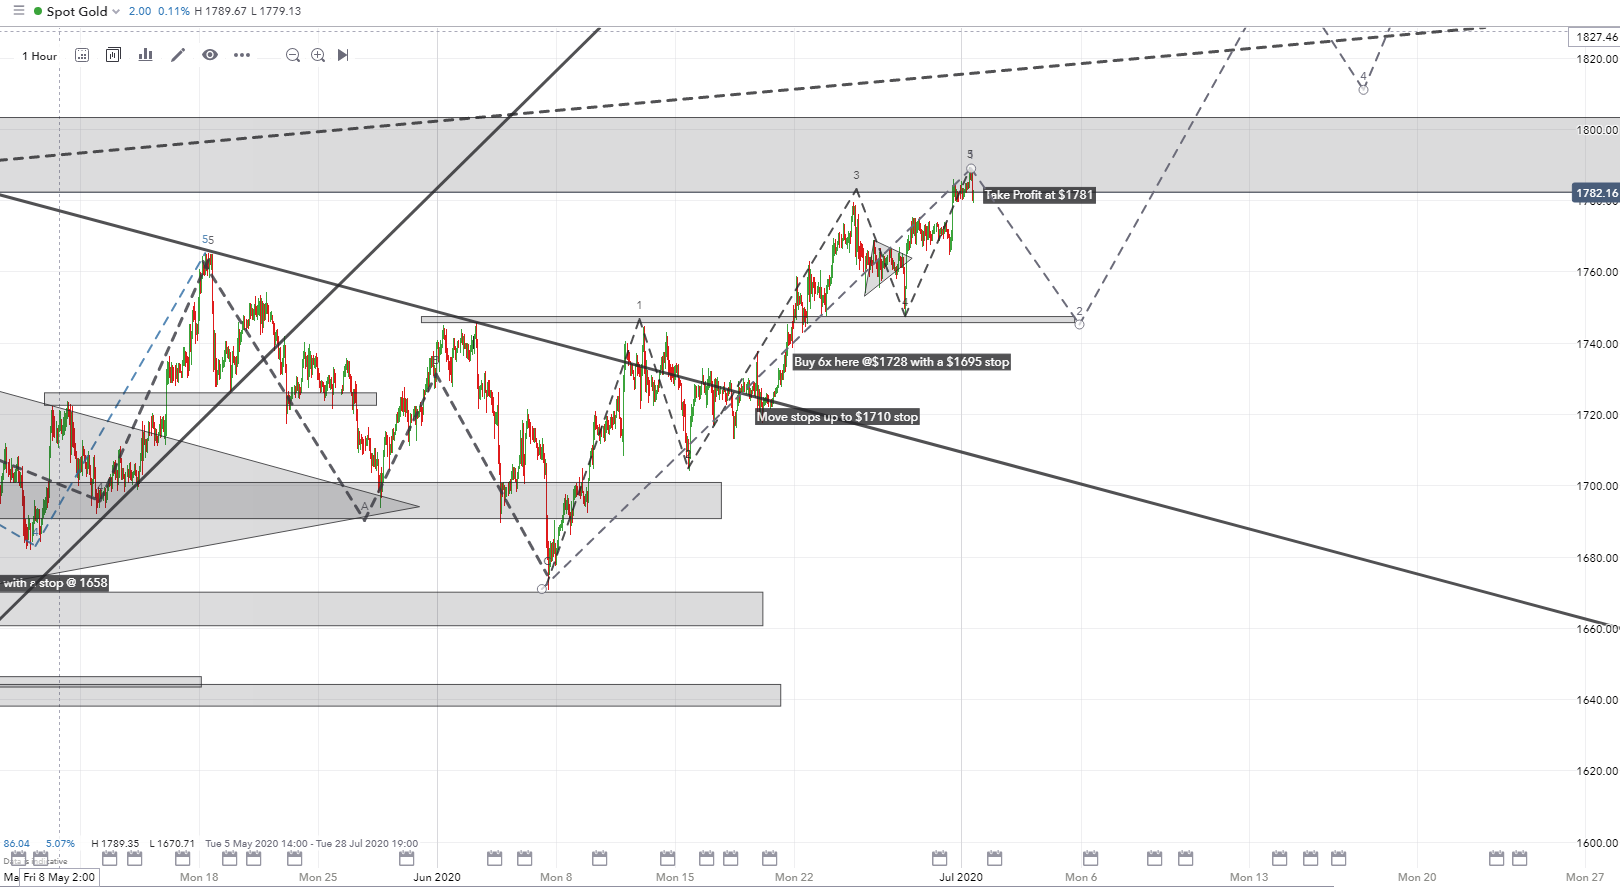
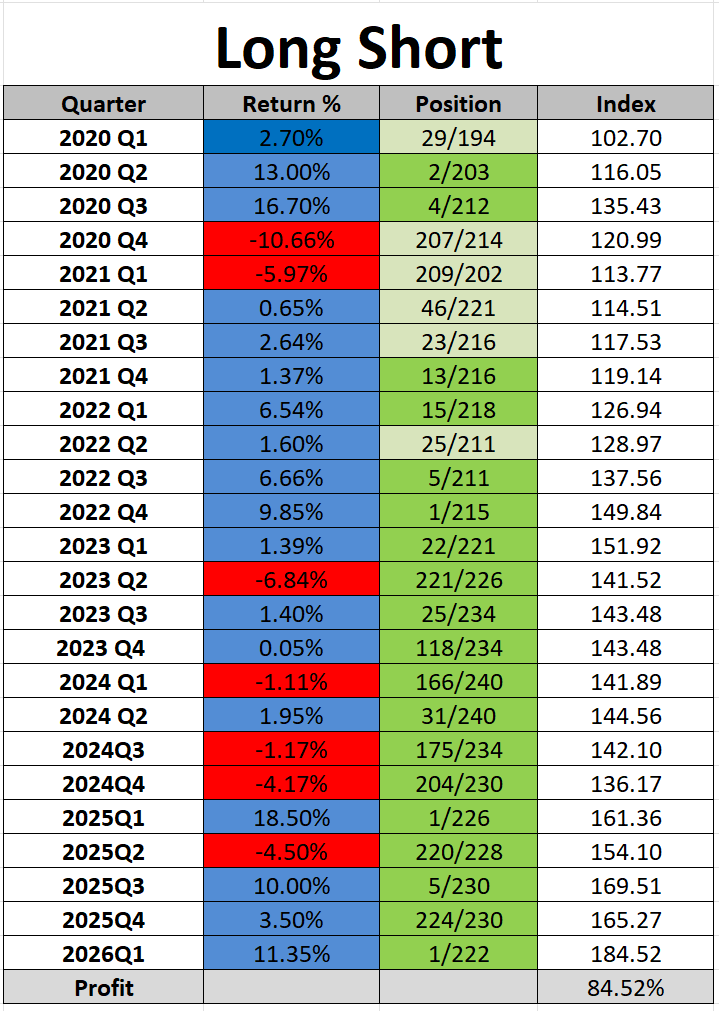
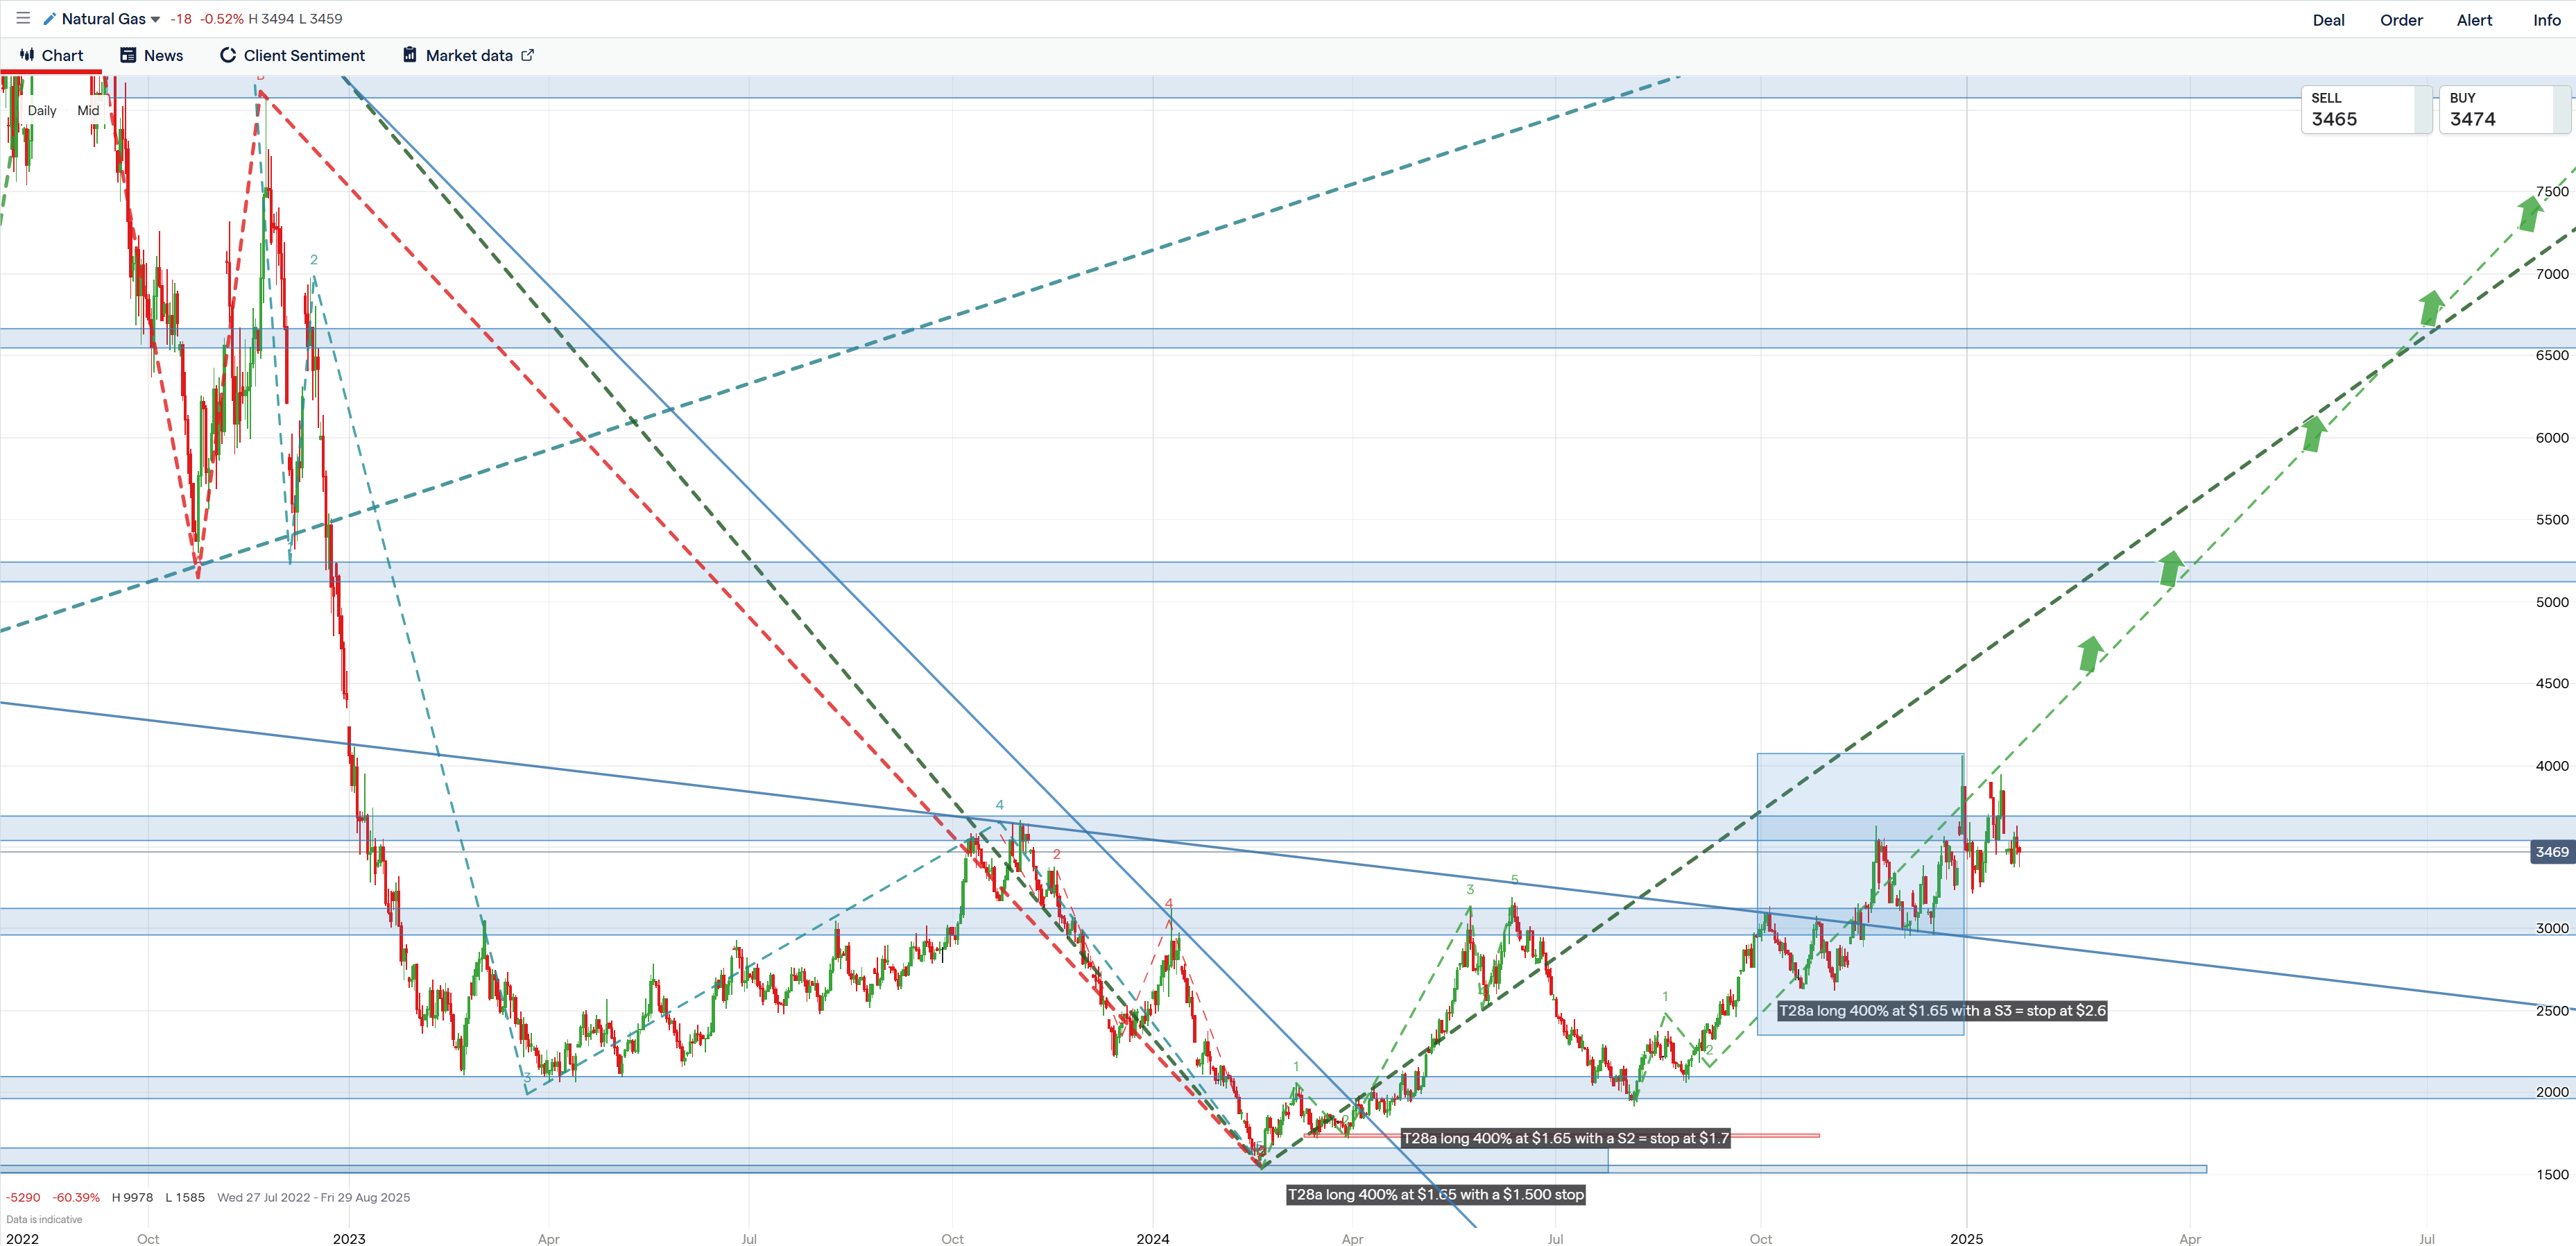
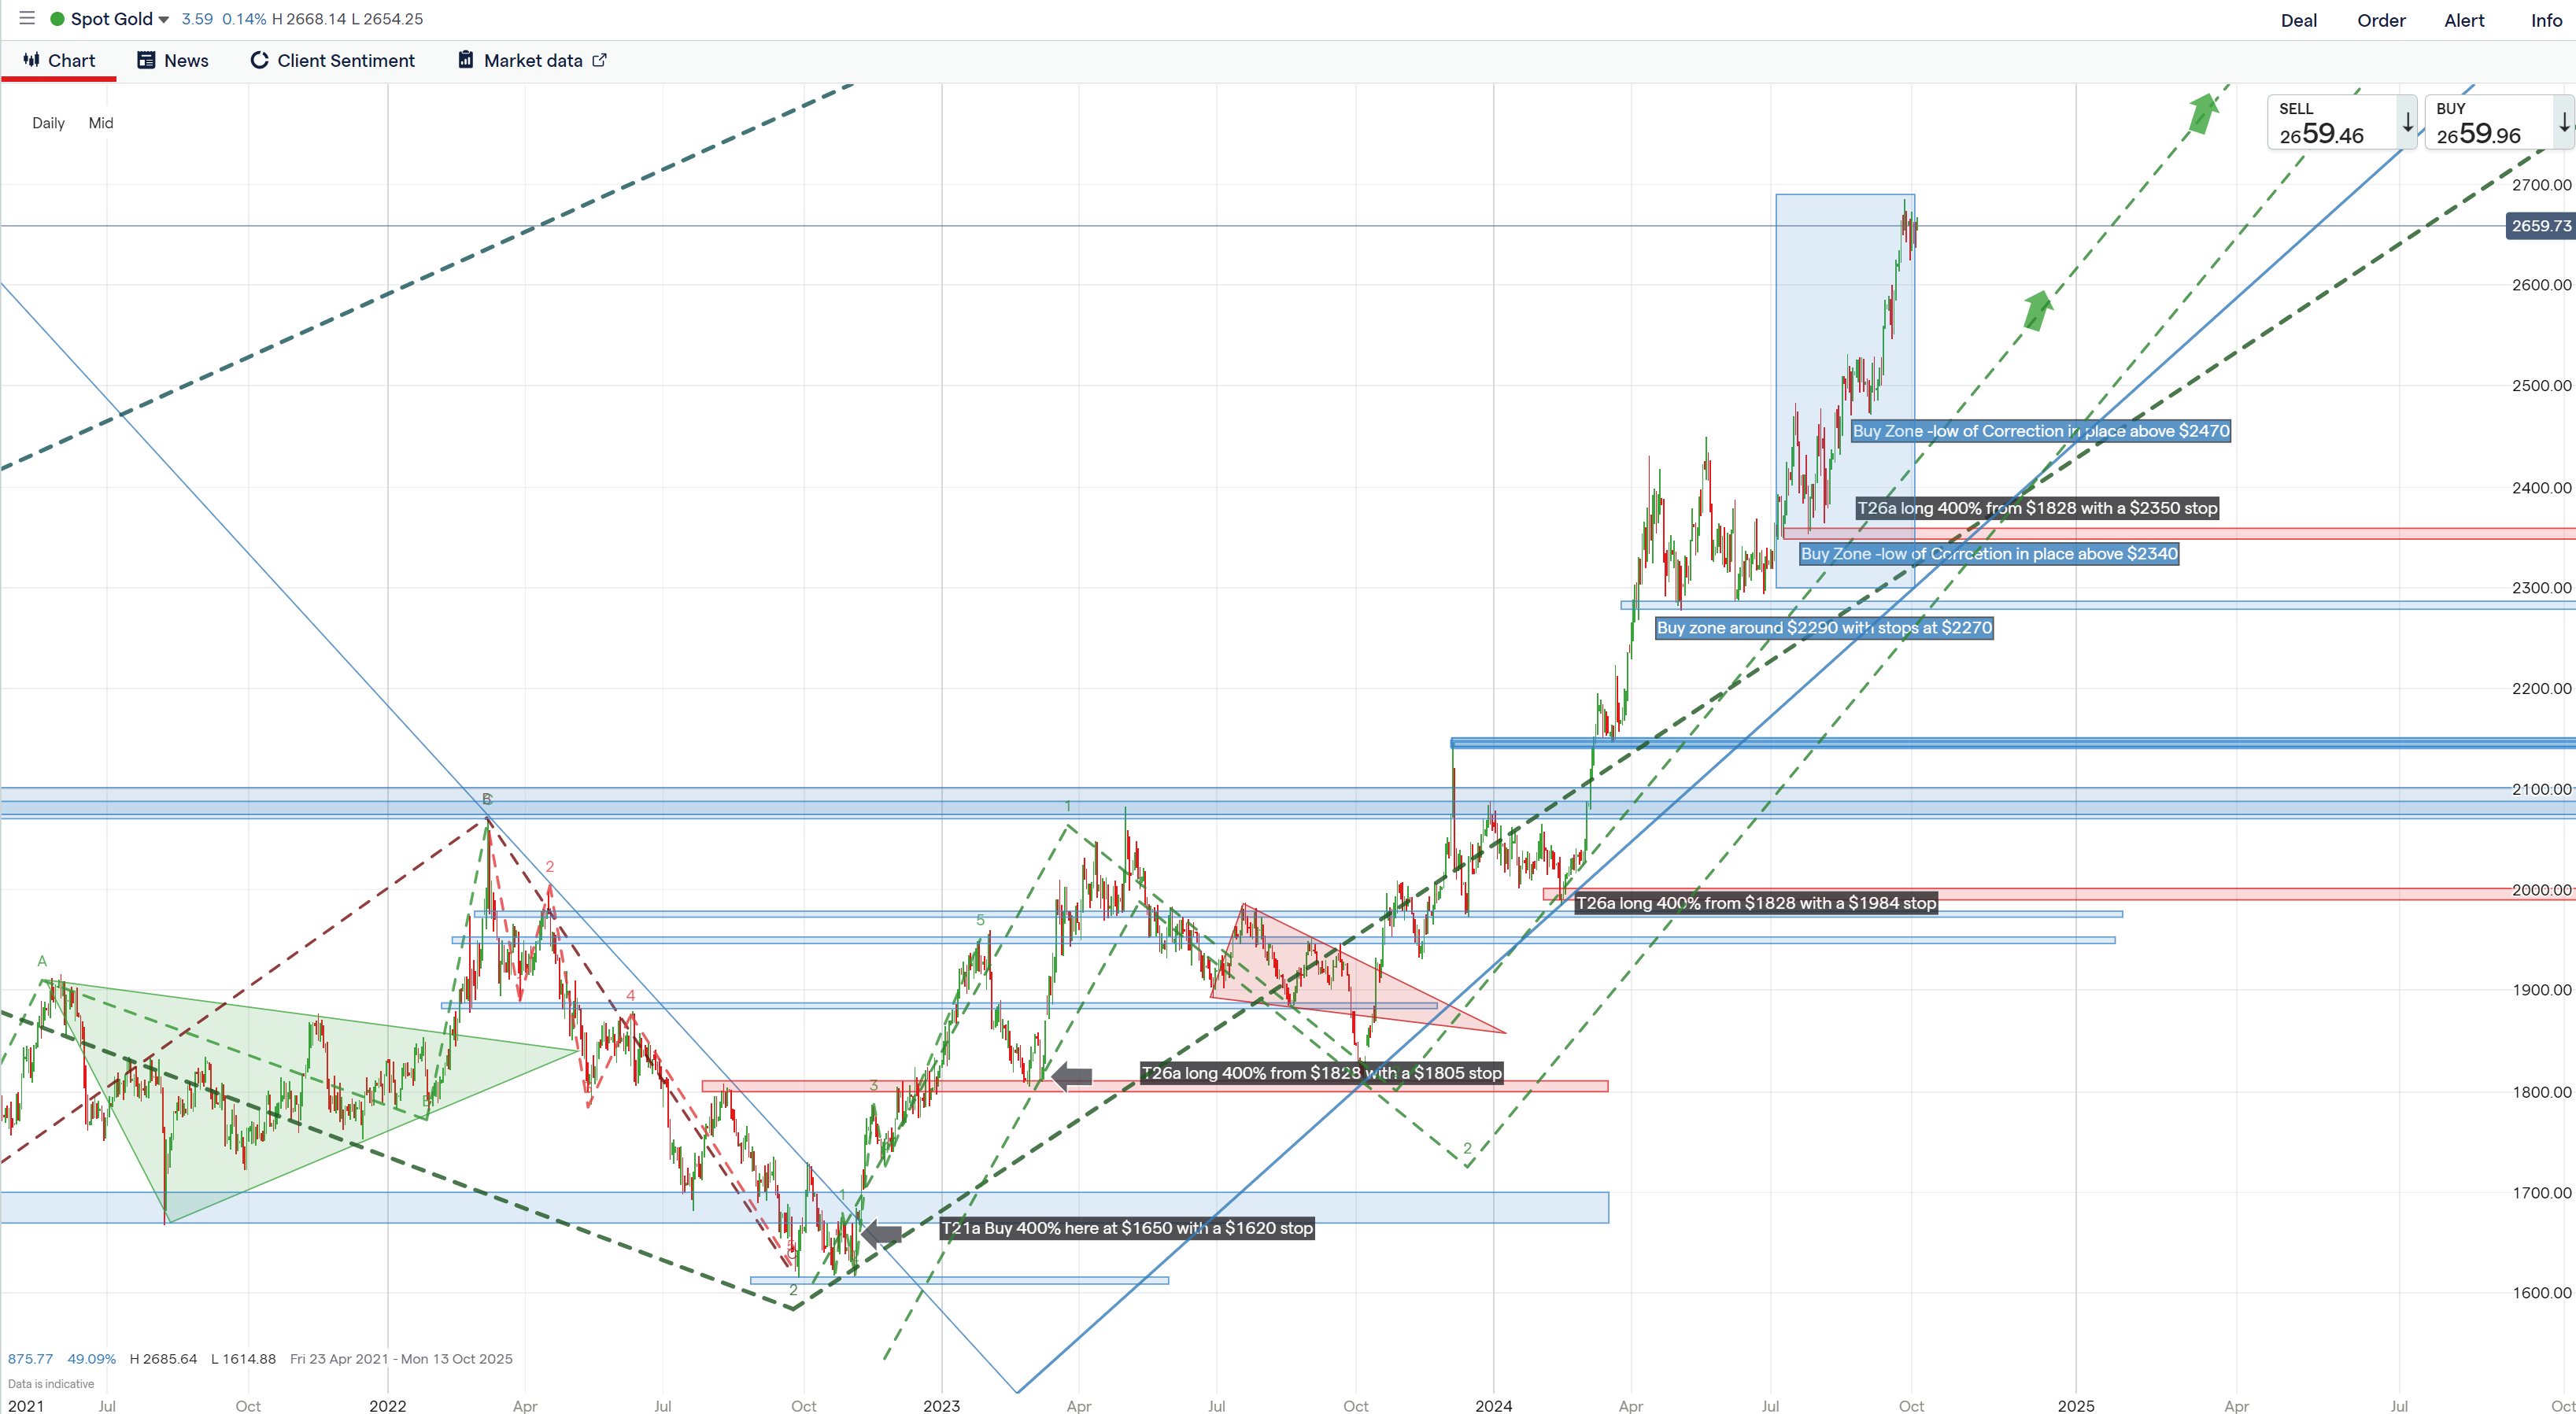
- We make specific real-time risk-adjusted trade recommendations, with entry points and stops, and recommended sizes relating to our evaluation of the quality of the trade (ranging from 33%, 66%, 100% 133%, 166%, 200%). The results are then published at the end of each quarter so that our performance in various sectors can be evaluated by our clients, allowing them to assess the reliability of our forecasts and the quality of our returns. New trades are sent within five minutes of publication to clients’ emails, providing actionable real-time trade recommendations. This is ideal for risk-takers who seek specific trade recommendations with precise low-risk-high-reward entry points. The sequence of Gold trades below shows our process.
Click a chart to view a larger version.
Please use the tabs above to view our USP, a sample CIOs Long–Short View, quarterly appraisals, testimonials, FAQs and our full list of prices with links to subscribe.
1. Who Are Our Clients?
Global Forecaster’s clients range from the largest pension funds and hedge funds in the world to family offices, professional investors (as defined by the FCA). All who value our long and medium-term strategies. Whilst our hedge fund clients benefit from our specific trading recommendations as part of an integrated strategy. All benefit from the increase of 360-degree situational awareness that we offer, derived from a source of analysis that is independent of the impact of collective sentiment that makes most analysis bullish at the highs and bearish at the lows.
- Banks
- Pension Funds
- Resource and commodity companies
- Hedge Funds (Macro and Long/short)
- Corporate Treasuries
- Family Offices
- HNWIs
2. How To Access Our Market Analysis and Predictions
Global Forecaster has created a range of Products for the needs of both Macro Directional and Long–Short Clients; All new updates will arrive by email to your inbox within 5 minutes of publication. We offer paid trials of 3 months and thereafter 12-month rolling subscriptions. All prices are ex-VAT.
1. The CIOs Long–Short View service is designed to provide long-term and medium-term investment outlooks for long-short funds and aims to follow a portfolio of 50 shares from the sectors that we cover. We use our macro construct as expressed in our CIOs Macro View to find favoured thematics that allow us to then focus on our chosen sectors, eg we might be bullish on oil so we would then focus on the oil sector. Then within the sector, we look for the strongest share to express a bull view and the weakest share to express a bear view. Thus we use a top-down bottom ups methodology that has proven very successful. Our portfolio is then updated as and when major market events provide new information to manage our active portfolio. This product is ideal for long/short funds, who seek specific trade strategic and detailed recommendations. When combined with our Premium Long–Short View this seeks to provide precise low risk-high reward entry points. £1500 per month per subscriber.
2. The Premium CIOs Long–Short View – this service is designed to provide long-term and medium-term investment outlooks into long and short positions in specific shares in a range of markets outlined below. We provide real-time entry points and stops and recommended sizes relating to our evaluation of the quality of the trade (ranging from 33%, 66%, 100% 133%, 166%, 200%). Our results are published at the end of each quarter, so that our performance in various sectors can be evaluated by our clients, allowing them to assess the reliability of our forecasts and the quality of our returns. New trades are sent via emails providing actionable real-time trade recommendations. This product is ideal for risk-takers who seek specific trade recommendations with precise low-risk-high reward entry points. £3500 per month per subscriber. They cover the following sectors:
- Agriculture
- Aviation
- Banks
- Consumer
- Credit
- Energy
- Entertainment
- Funds
- Heavy Industry
- Hi-Tech
- Homebuilders
- Mining
- Precious Metals
- Russell 2000
- Space
3. The Long/Short Package includes The CIOs Long–Short View, The Premium CIOs Long–Short View and Equity Indices Executions £5000 per month per subscriber. In addition, advisory packages are available on request.
4. The External CIO – provides a bespoke service that integrates every aspect of The Long–Short Package subscription with the risk-taking aspects of our clients portfolios through personnel discussion and interaction. This also includes objective support with respect to the harnessing of trading psychology to maximise profitability. A useful tool to maximise returns when under pressure from losses, or indeed after having an excellent run of profitability. Price by agreement. Engage David
Individual Share Analysis & Forecasts
The CIOs Long–Short View
This product is ideal for long–short funds, who seek specific trade strategies and detailed recommendations. When combined with our Individual Share Analysis & Forecasts this seeks to provide precise low risk-high reward entry points.
1 month - £1500

Access to The CIOs Long–Short View - long-term and medium-term investment outlooks for long-short funds and aims to follow a portfolio of 50 shares from the sectors that we cover, within a secure member’s area on the website. Also sent in a newsletter, within minutes of publication to the website.

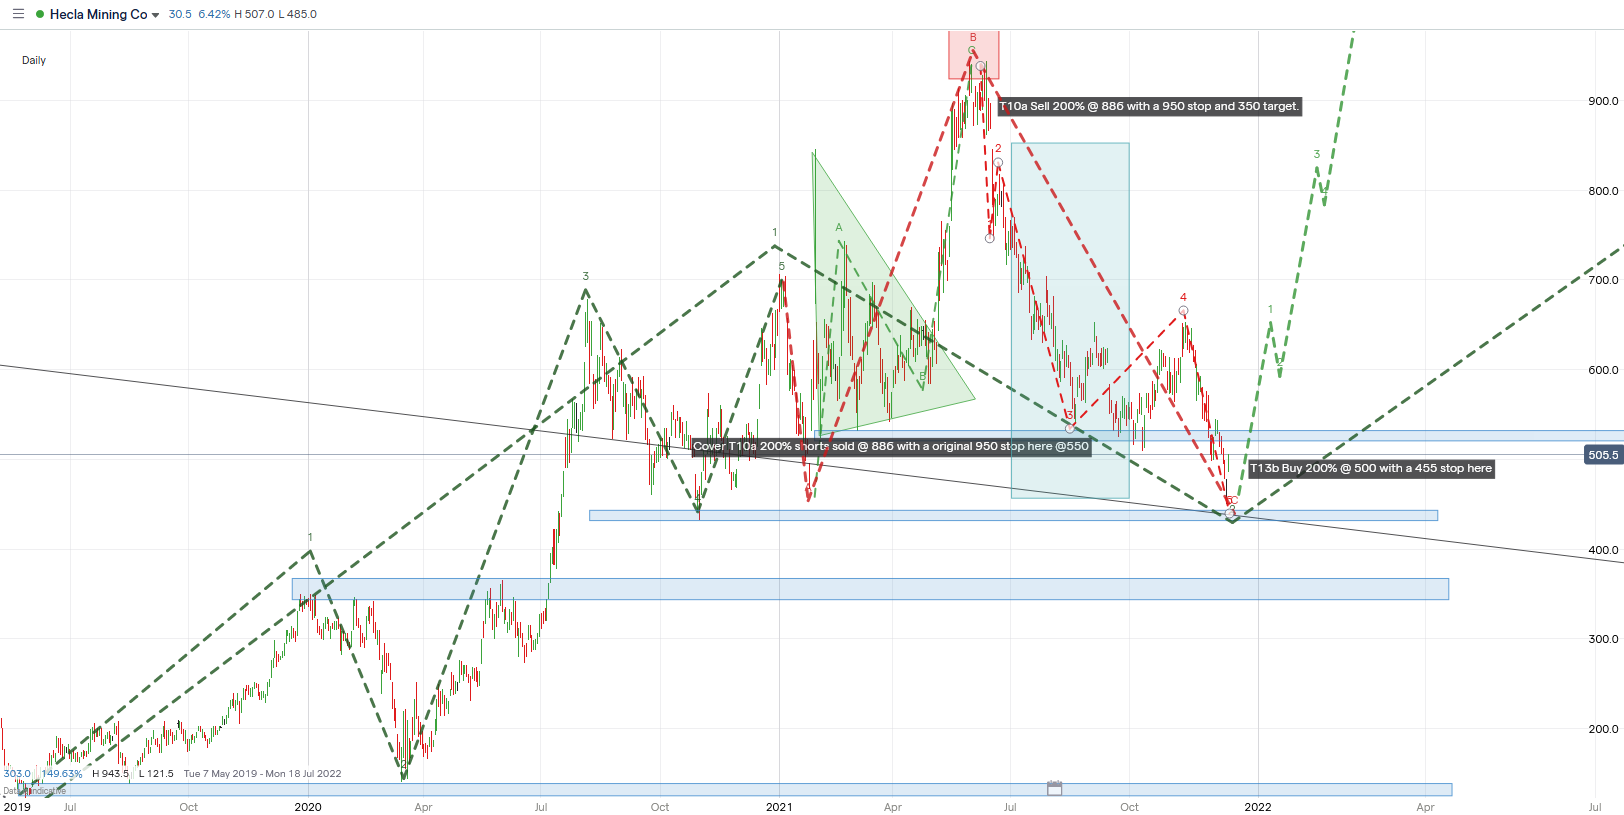
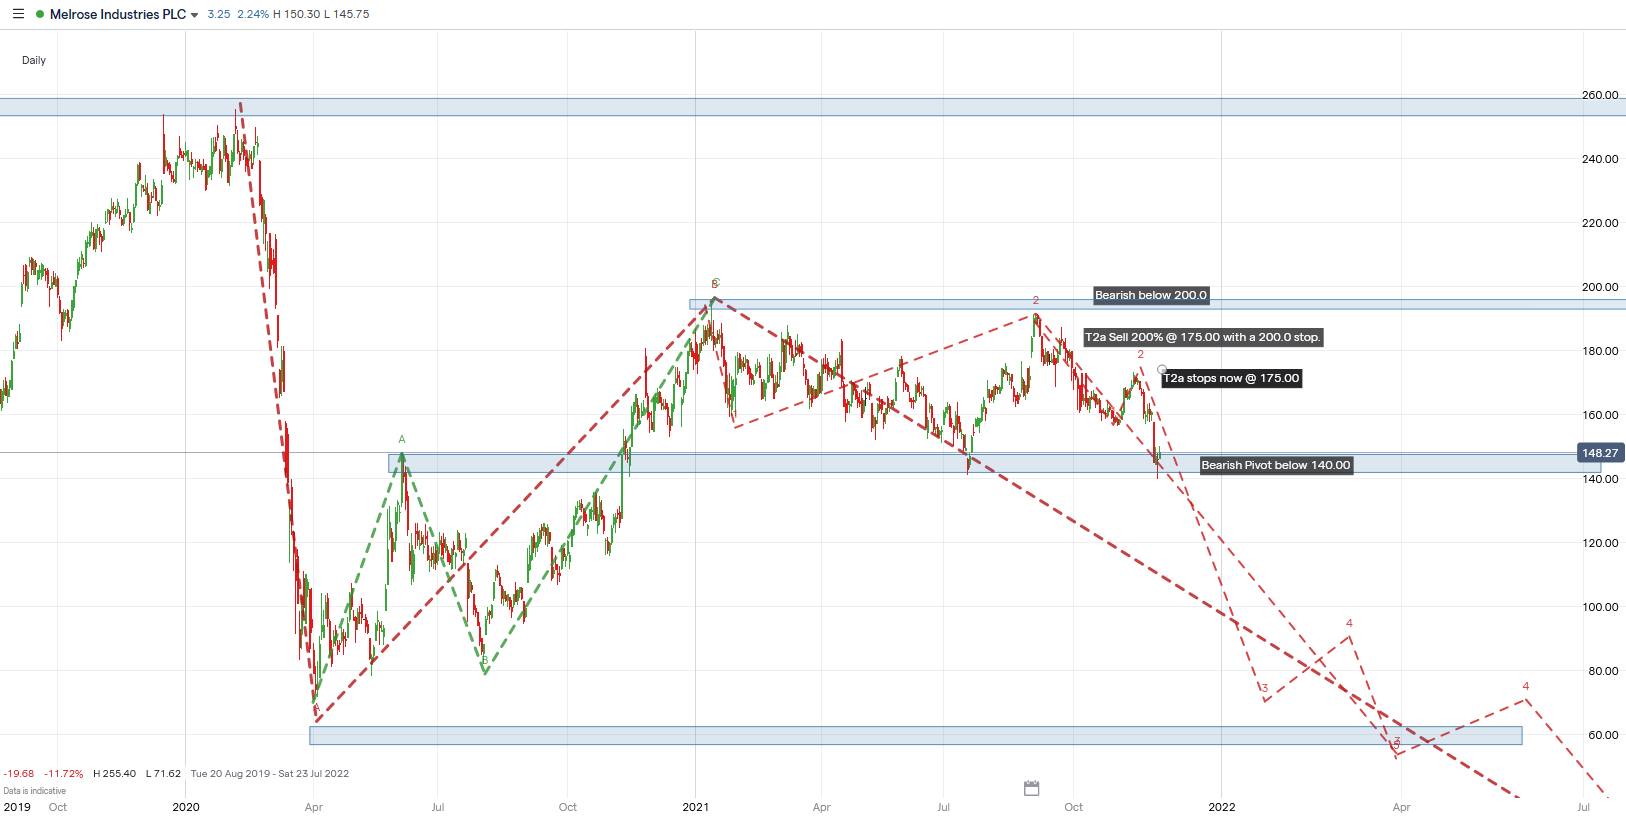
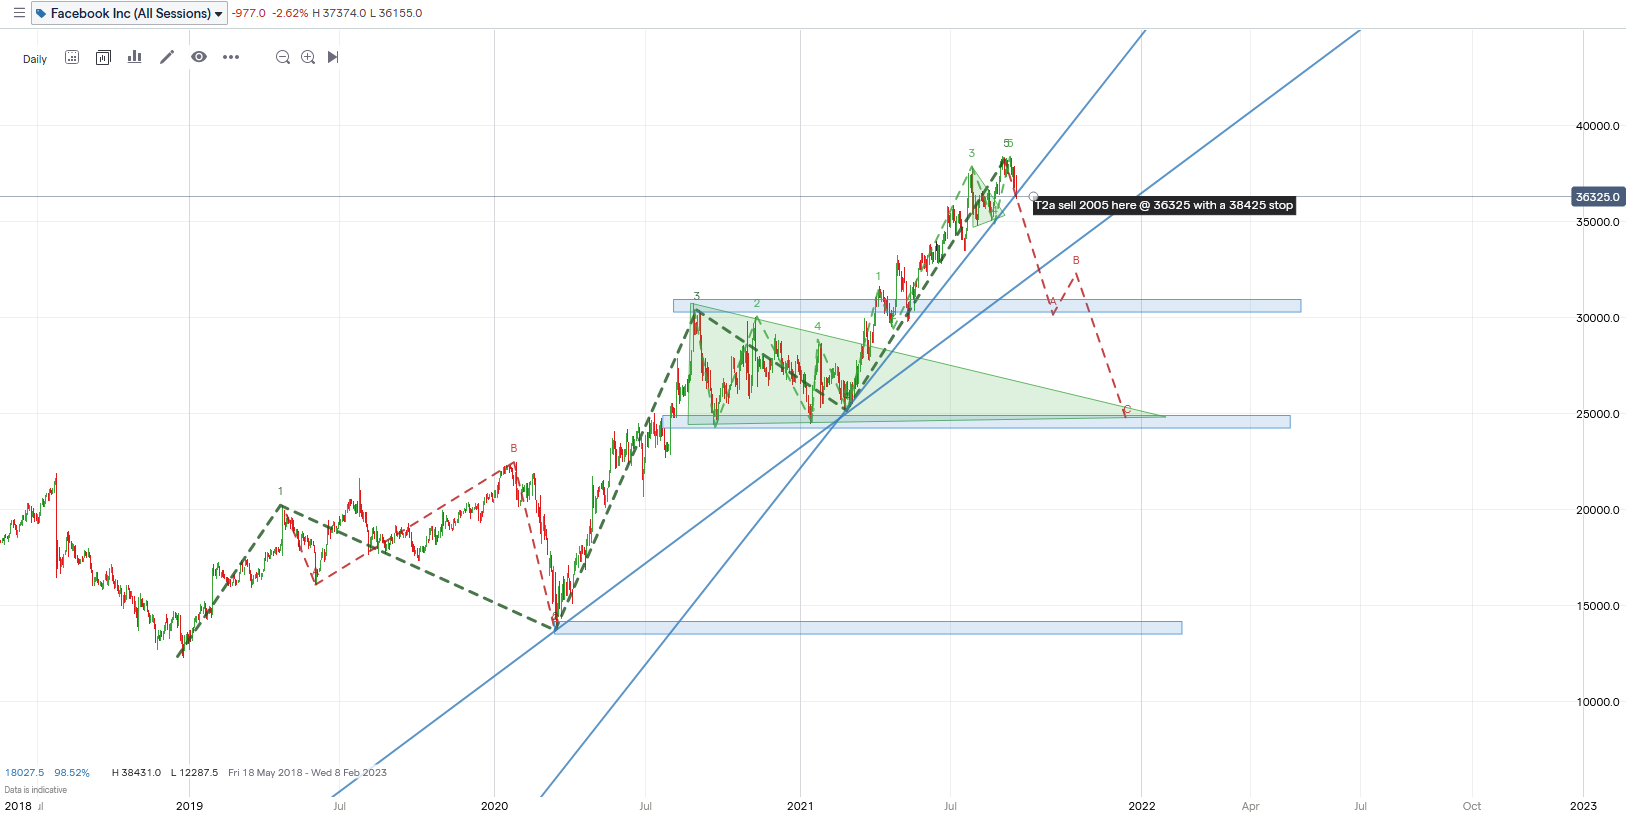
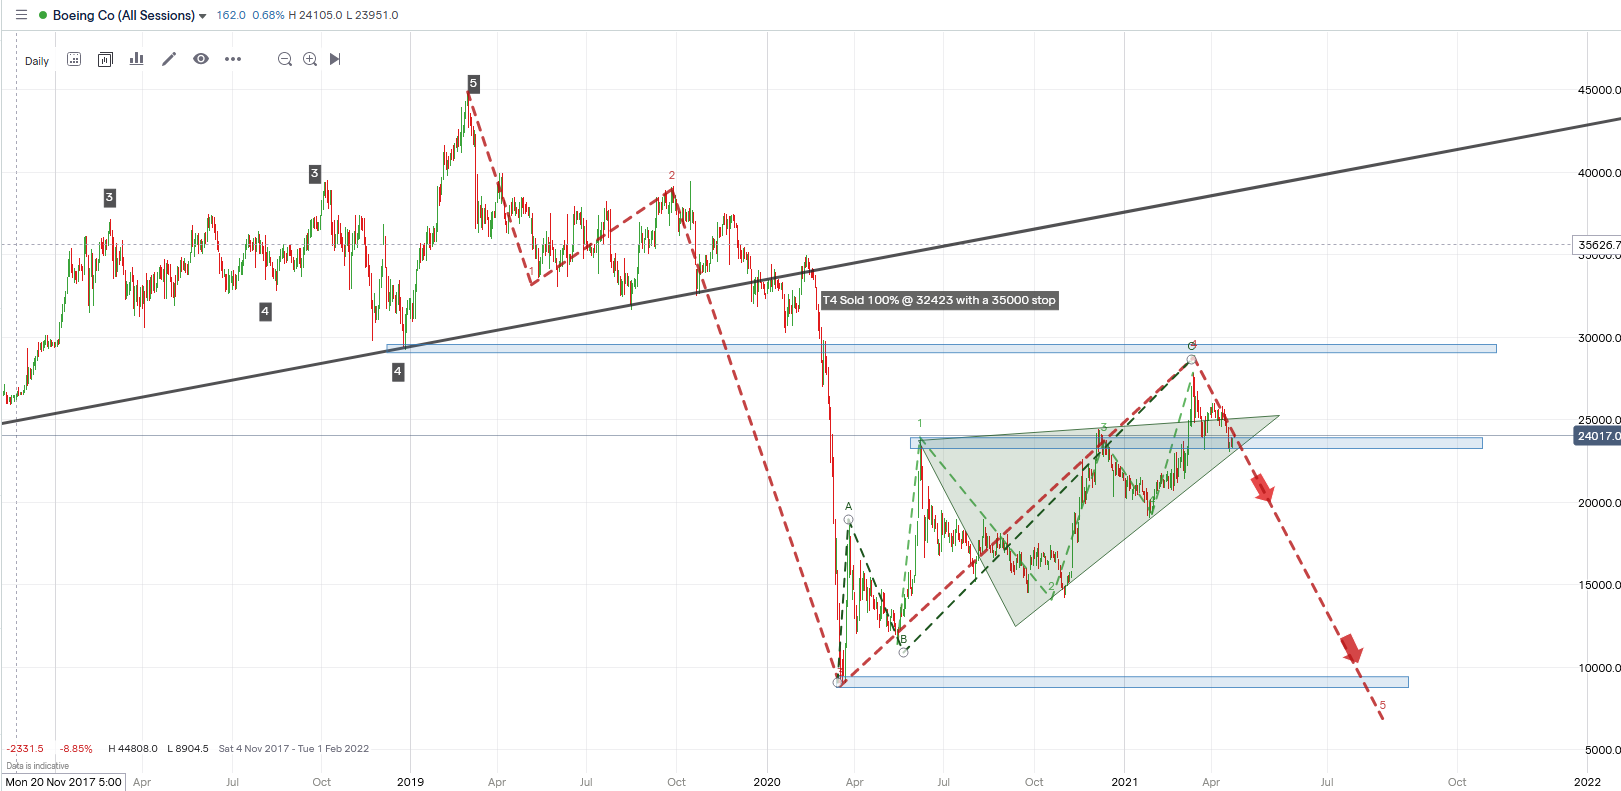
Access to David’s Long–Short Trade Executions - real-time trade recommendations across Agriculture, Aviation, Banks, Consumer, Credit, Energy, Entertainment, Heavy Industry, Hi-Tech, Homebuilders, Mining, Precious Metals, Russell 2000, Space and Travel, within a secure member’s area on the website. Also sent in a newsletter, within minutes of publication to the website.
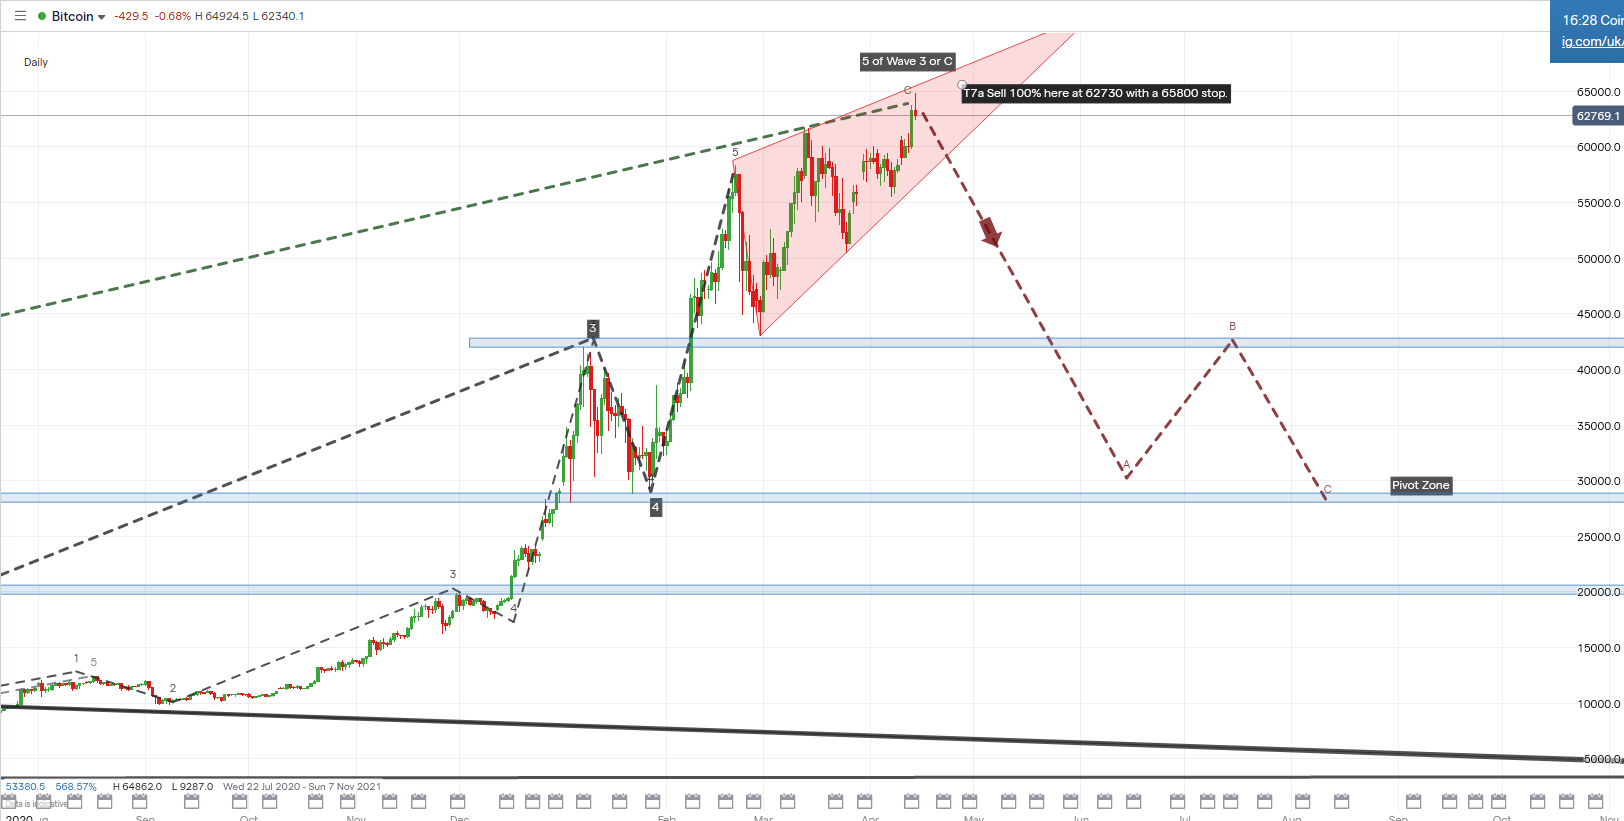
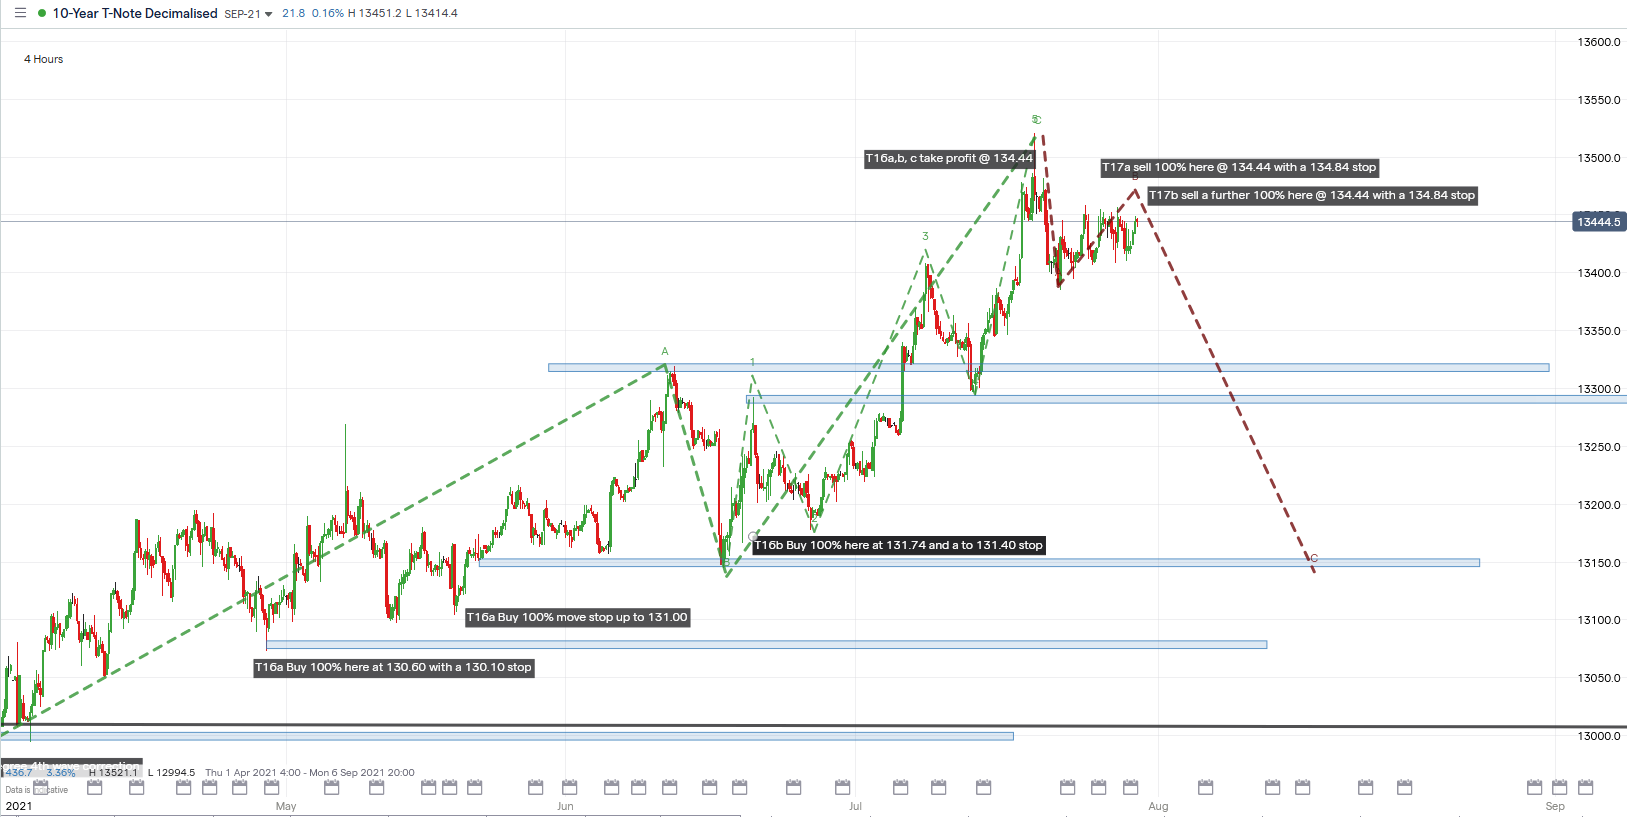
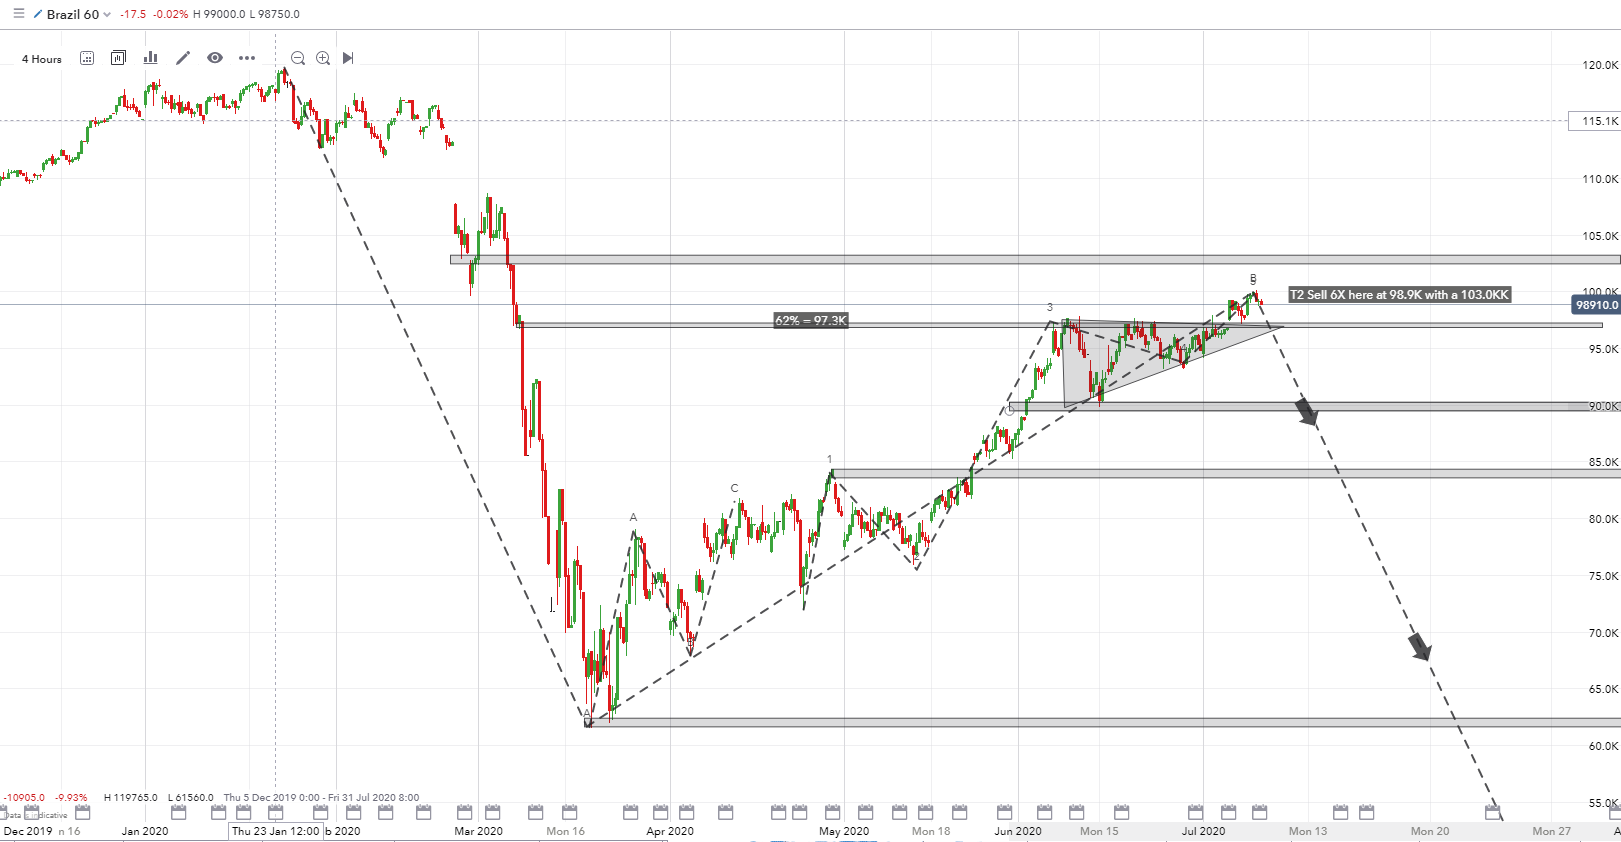
View an example execution
£1500 per month
+ VAT UK ONLY
The Premium CIOs Long–Short View
You’ll receive David’s invaluable real-time trade recommendations, including charts and market outlooks. Sectors covered include: Agriculture, Aviation, Banks, Consumer, Credit, Energy, Entertainment, Heavy Industry, Hi-Tech, Homebuilders, Mining, Precious Metals, Russell 2000, Space and Travel.
1 month - £3500
Access to The CIOs Long–Short View - long-term and medium-term investment outlooks for long-short funds and aims to follow a portfolio of 50 shares from the sectors that we cover, within a secure member’s area on the website. Also sent in a newsletter, within minutes of publication to the website.
Access to David’s Long–Short Trade Executions - real-time trade recommendations across Agriculture, Aviation, Banks, Consumer, Credit, Energy, Entertainment, Heavy Industry, Hi-Tech, Homebuilders, Mining, Precious Metals, Russell 2000, Space and Travel, within a secure member’s area on the website. Also sent in a newsletter, within minutes of publication to the website.
View an example execution
£3500 per month
+ VAT UK ONLY
Long/Short Package
David’s premium package is for anyone who seeks specific trade strategies and detailed recommendations.
You’ll receive David’s invaluable real-time trade recommendations, including charts and market outlooks, for Equity indices and individual shares across a range of sectors, within a secure member’s area on the website.
1 month - £5000
+ VAT UK ONLY
Access to The CIOs Long–Short View - long-term and medium-term investment outlooks for long-short funds and aims to follow a portfolio of 50 shares from the sectors that we cover, within a secure member’s area on the website. Also sent in a newsletter, within minutes of publication to the website.
Access to David’s Long–Short Trade Executions - real-time trade recommendations across Agriculture, Aviation, Banks, Consumer, Credit, Energy, Entertainment, Heavy Industry, Hi-Tech, Homebuilders, Mining, Precious Metals, Russell 2000, Space and Travel, within a secure member’s area on the website. Also sent in a newsletter, within minutes of publication to the website.
View an example execution
Access to David’s David’s Macro Trade Executions - real-time trade recommendations across Equity Indices, within a secure member’s area on the website. Also sent in a newsletter, within minutes of publication to the website.
View an example execution
Global Forecaster's registered office is:
The Mill, Blackdown Park, Haslemere, Surrey GU27 3BU
Liability disclaimer
-
Accuracy of Information
While every effort is made to provide accurate, clear, and complete information, the changing nature of laws and regulations may result in delays, omissions, or inaccuracies on this website. David Murrin does not guarantee that the website will be error-free, free from omissions, viruses, interruptions, or delays. The information is provided "as is" without warranties of any kind, express or implied, including accuracy, timeliness, and completeness. -
Liability
The information on this website is for general guidance only and does not constitute professional advice. Users should seek professional advice before making any decisions. Neither David Murrin Global Forecaster nor its associated companies—Apollo Analysis and Emergent Asset Management—accept liability for any loss, personal or business, resulting from actions taken or not taken based on the information provided. -
Hyperlinks
This website contains hyperlinks to third-party websites. David Murrin does not guarantee the accuracy or reliability of information on these external websites. Links to third-party websites do not imply endorsement and are provided solely for user convenience. -
Trading and Investment Risks
Trading and investing in futures, options, bonds, cryptocurrencies, FX, precious metals, and shares involve significant risks. Users must understand and accept these risks before investing. Do not trade with money you cannot afford to lose. This website and its content do not constitute a solicitation or offer to buy or sell any financial instruments. Past performance does not guarantee future results. Users should consult a financial advisor before making investment decisions. -
Use of Information at Own Risk
Users access and use the information on this website at their own risk. Global Forecaster does not guarantee the accuracy, timeliness, performance, completeness, or suitability of the provided content. The information is for educational purposes only, and errors or inaccuracies may exist. Global Forecaster excludes liability to the fullest extent permitted by law. -
Performance Results
Hypothetical or simulated performance results have limitations. Unlike actual performance records, simulated results do not represent real trading. These results may overestimate or underestimate market conditions such as liquidity. No representation is made that any account will achieve profits or losses similar to those shown. -
Definition of a Professional Investor
These services are intended for professional investors only—i.e., investors classified as professional clients or those who may, upon request, be treated as such, as defined by the FCA under Annex II of MiFID II. A professional investor has the experience, knowledge, and expertise to make independent investment decisions and assess associated risks. The FCA categorises professional clients into two main groups:-
Professional Clients
These are clients who automatically qualify as professional investors, including:-
Entities required to be authorised or regulated to operate in financial markets, such as:
-
Investment firms
-
Credit institutions
-
Insurance companies
-
Pension funds
-
Commodity and derivative dealers
-
Other institutional investors
-
-
Large undertakings meeting at least two of the following criteria:
-
Balance sheet total: €20 million
-
Net turnover: €40 million
-
Own funds: €2 million
-
-
National and regional governments, public bodies managing public debt, central banks, and supranational institutions.
-
Institutional investors whose main activity is to invest in financial instruments.
-
-
Elective Professional Clients
A client who does not automatically qualify as a professional investor but can request to be treated as one. To qualify, they must:-
Pass the Qualitative Test: The firm must assess that the client has sufficient experience, knowledge, and expertise to make investment decisions and understand the associated risks.
-
Meet at least two of the following three Quantitative Criteria:
-
Have carried out significant transactions (at least 10 per quarter over the last year) in relevant markets.
-
Have a financial instrument portfolio (including cash deposits and investments) of at least €500,000.
-
Have worked in the financial sector for at least one year in a professional role requiring knowledge of the relevant transactions or services.
-
-
-
Implications of Being a Professional Investor
-
Professional clients receive fewer regulatory protections than retail clients.
-
They do not benefit from certain FCA protections, such as best execution rules and some suitability requirements.
-
-
-
Subscriptions and Conditions
Subscriptions include The CIO’s Macro View, The Premium Macro View, Trade Executions, The Global Macro Package, and The Arkent Fund (“the Service”):-
Subscriptions and renewals require 100% advance payment.
-
The subscription period starts upon payment realization.
-
No refunds will be provided for subscription periods, even if terminated early.
-
Subscription renewals require mutual agreement unless stated otherwise in a separate contract.
-
Investment decisions are the sole responsibility of the subscriber.
-
Recommendations are based on market analysis but may change due to market dynamics. Global Forecaster is not liable for any resulting losses.
-
-
No Redistribution of Information
The services are intended solely for the subscriber. Redistribution, resale, broadcasting, or transfer of the provided information without prior written authorization from David Murrin Global Forecaster is prohibited. -
Sources of Information
Information provided through the services is obtained from sources believed to be reliable. However, due to the nature of electronic distribution, there may be delays, omissions, or inaccuracies. -
Compliance with Laws
Global Forecaster complies with all applicable UK laws and regulations, including but not limited to securities laws, insider trading, anti-bribery, modern slavery, corporate tax evasion, data protection, and anti-corruption laws. No material non-public information will be provided to subscribers. -
Intellectual Property Rights
All content on this website is the intellectual property of David Murrin and Global Forecaster unless stated otherwise. Copyright and all associated rights are reserved. -
Unauthorized Use
Unauthorized use of any website materials may violate copyright, trademark, and other laws. Website materials may not be modified, reproduced, publicly displayed, distributed, or used for commercial purposes without permission. -
External Links
This website contains links to other websites. However, this Privacy Policy applies only to personal data collected via the website operated by David Murrin Global Forecaster. We are not responsible for the privacy policies of other sites. -
Use of Email
While we take measures to protect communications to and from our website, we cannot guarantee the confidentiality of emails before they arrive or after they leave our systems. -
Payment and Acceptance
These terms apply to subscribers using the online payment services provided by Global Forecaster and its affiliates, as well as payments made directly via invoice and bank transfer. Authorising a payment is deemed acceptance of these terms. Global Forecaster reserves the right to amend these terms at any time. -
Confidentiality
Global Forecaster’s subscription services involve a one-way provision of information. We respect and uphold client confidentiality for consultancy services, specifically The External CIO and Murrin’s One-to-One services. -
Governing Law
This Agreement and any related non-contractual obligations shall be governed by and interpreted under English law. The English courts have exclusive jurisdiction over disputes arising from this Agreement.
Summary of Global Forecaster
Global Forecaster is a world leader in predicting geopolitical and financial market moves, leading to high alpha generation.
The Global Forecaster’s range of products has been designed to be the perfect adjunct to enhance CIOs and risk-takers investment returns. We provide a fully accountable real-time trade recommendation platform. This allows our clients to access the systematic trading inputs from an external Alpha-generating CIO, with 35 years of macro directional trading experience.
Recommendations are made based on pattern recognition techniques in some 5 sectors and 80 markets within the macro markets complex and 200 shares and are structured as a transparent real-time portfolio. Our strategies are published as The CIOs Long–Short View, which highlights the Geopolitical views contained in our Murrinations Insights that should be included in the investment thesis. Our financial analysis service then gives recommendations of trades that we are running and the new ones we will be looking to put on. Then every new trade recommendation is notified by an email alert, with a real-time trade with an entry point/stop level/size.
Individual Shares
- AVIATION
- BANKING
- CREDIT
- ENERGY
- ENTERTAINMENT
- HI-TECH
- HEAVY INDUSTRY
- HOMEBUILDERS
- MINING
- PRECIOUS METALS
- RUSSELL 2000
- SPACE
Global Forecaster Trade Recommendations
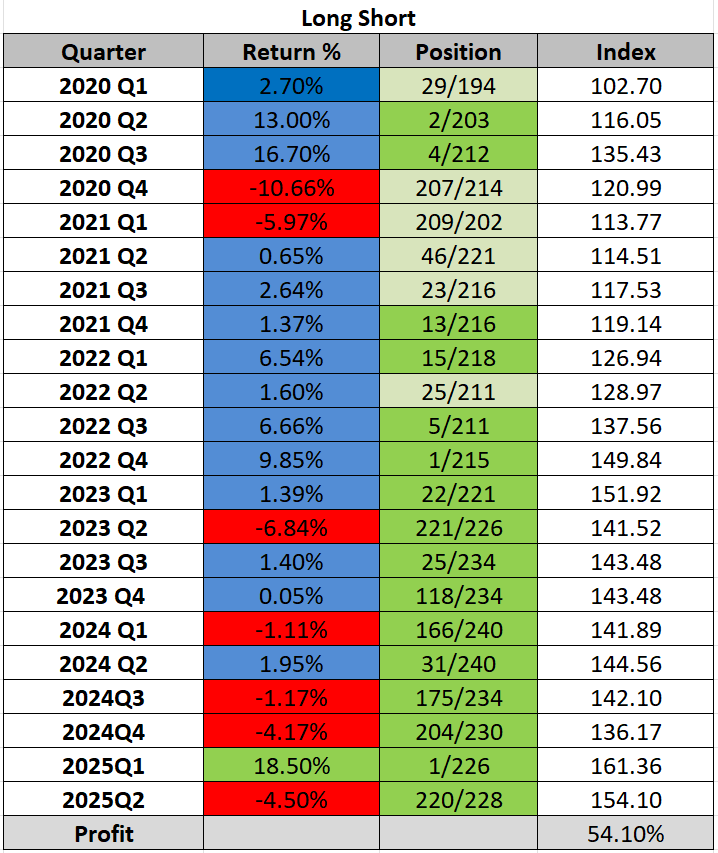
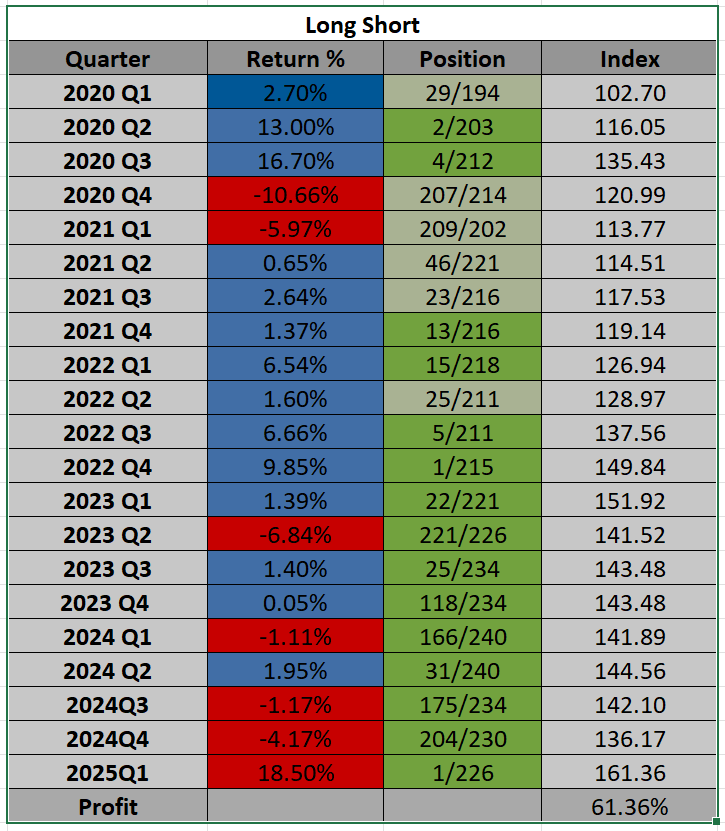
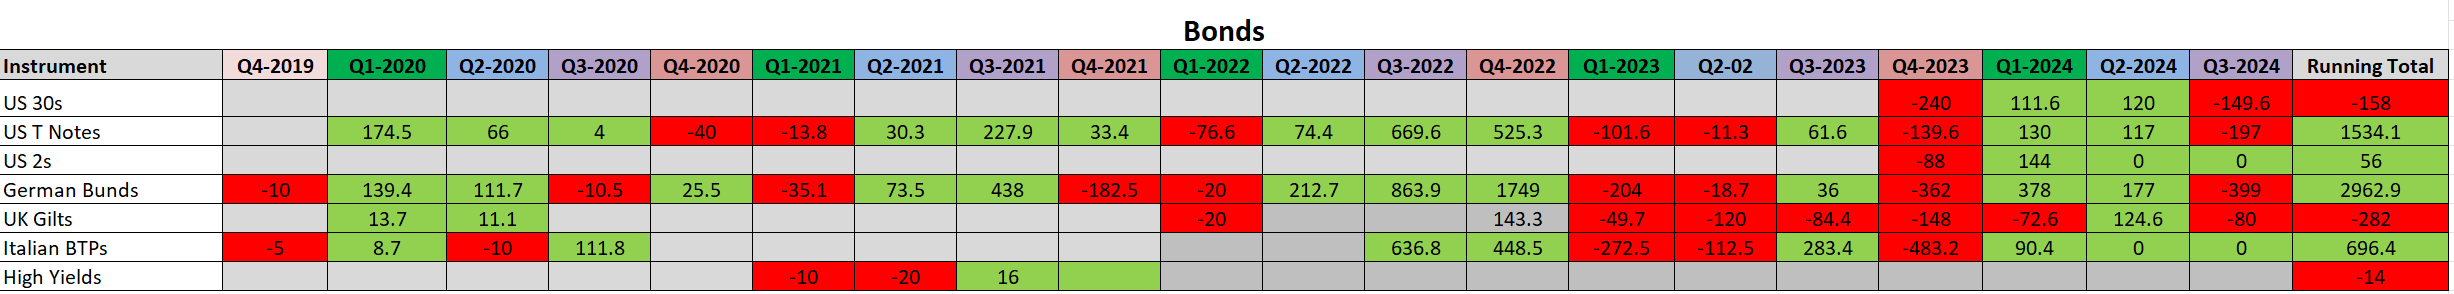
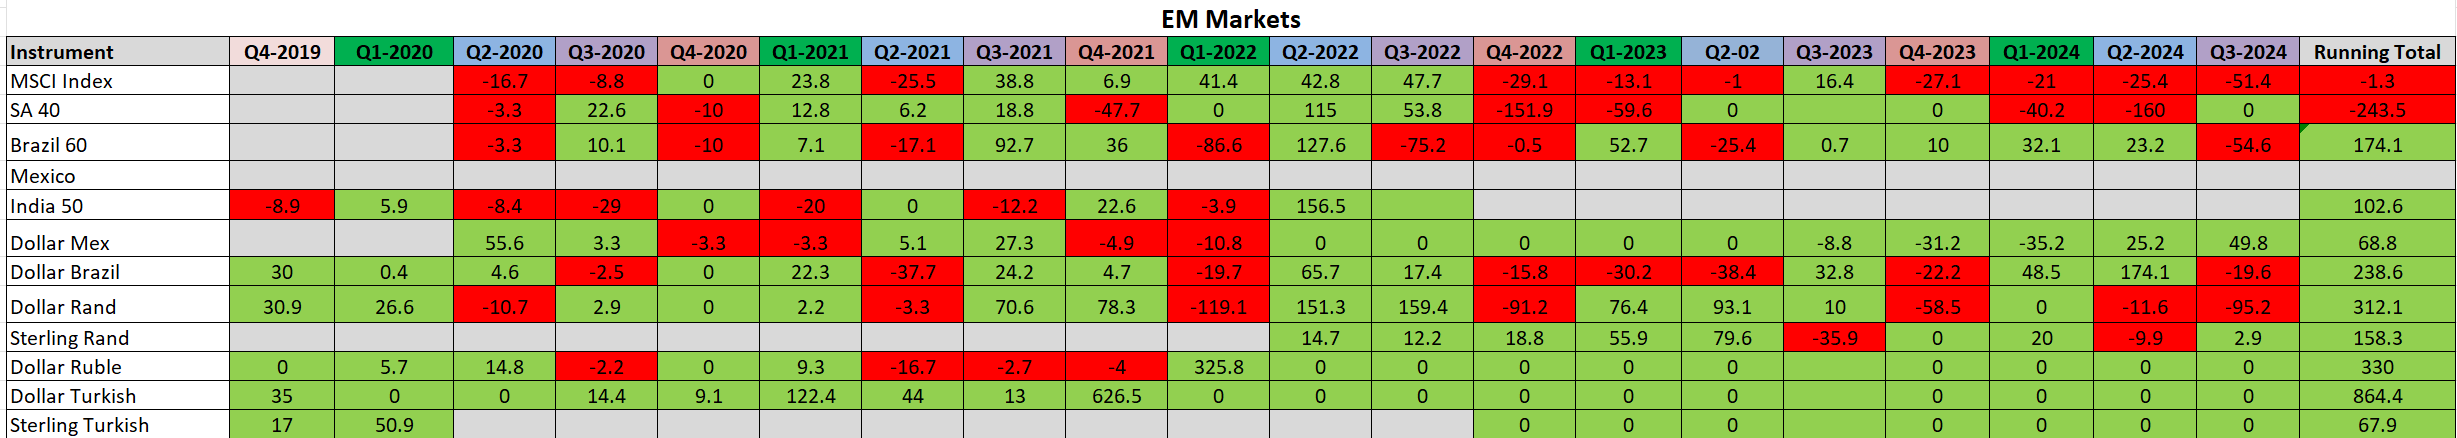
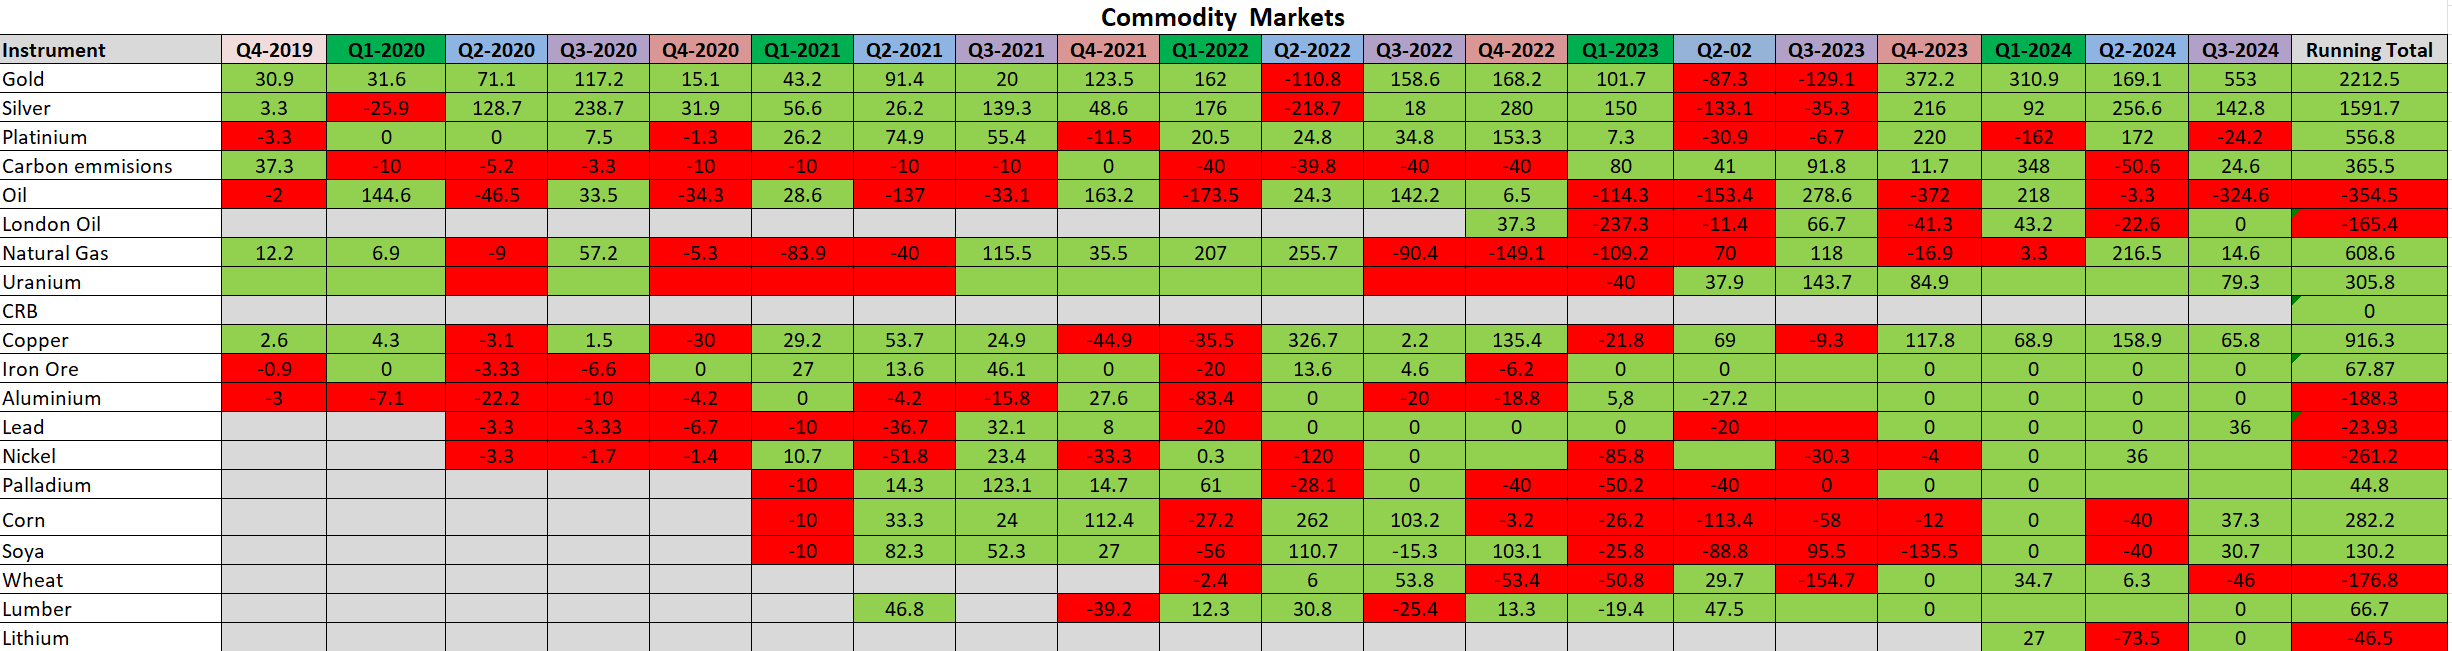
GF is structured to be a transparent real-time portfolio. The strategy, published as The CIOs Long–Short View, which highlights the geopolitical views from our Murrinations Insights that should be included in the investment thesis. The conclusion then gives outlines of trades we are running and the new ones we will be looking to put on. Then every new trade recommendation is notified by an email alert. With a real-time trade with an entry point/stop level/size.
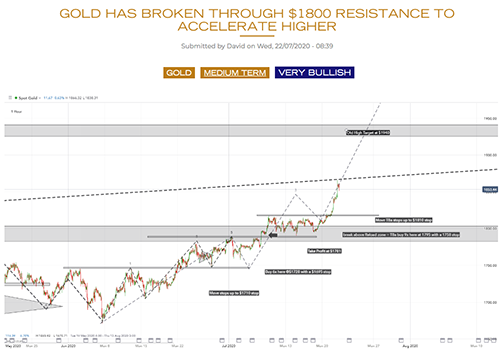
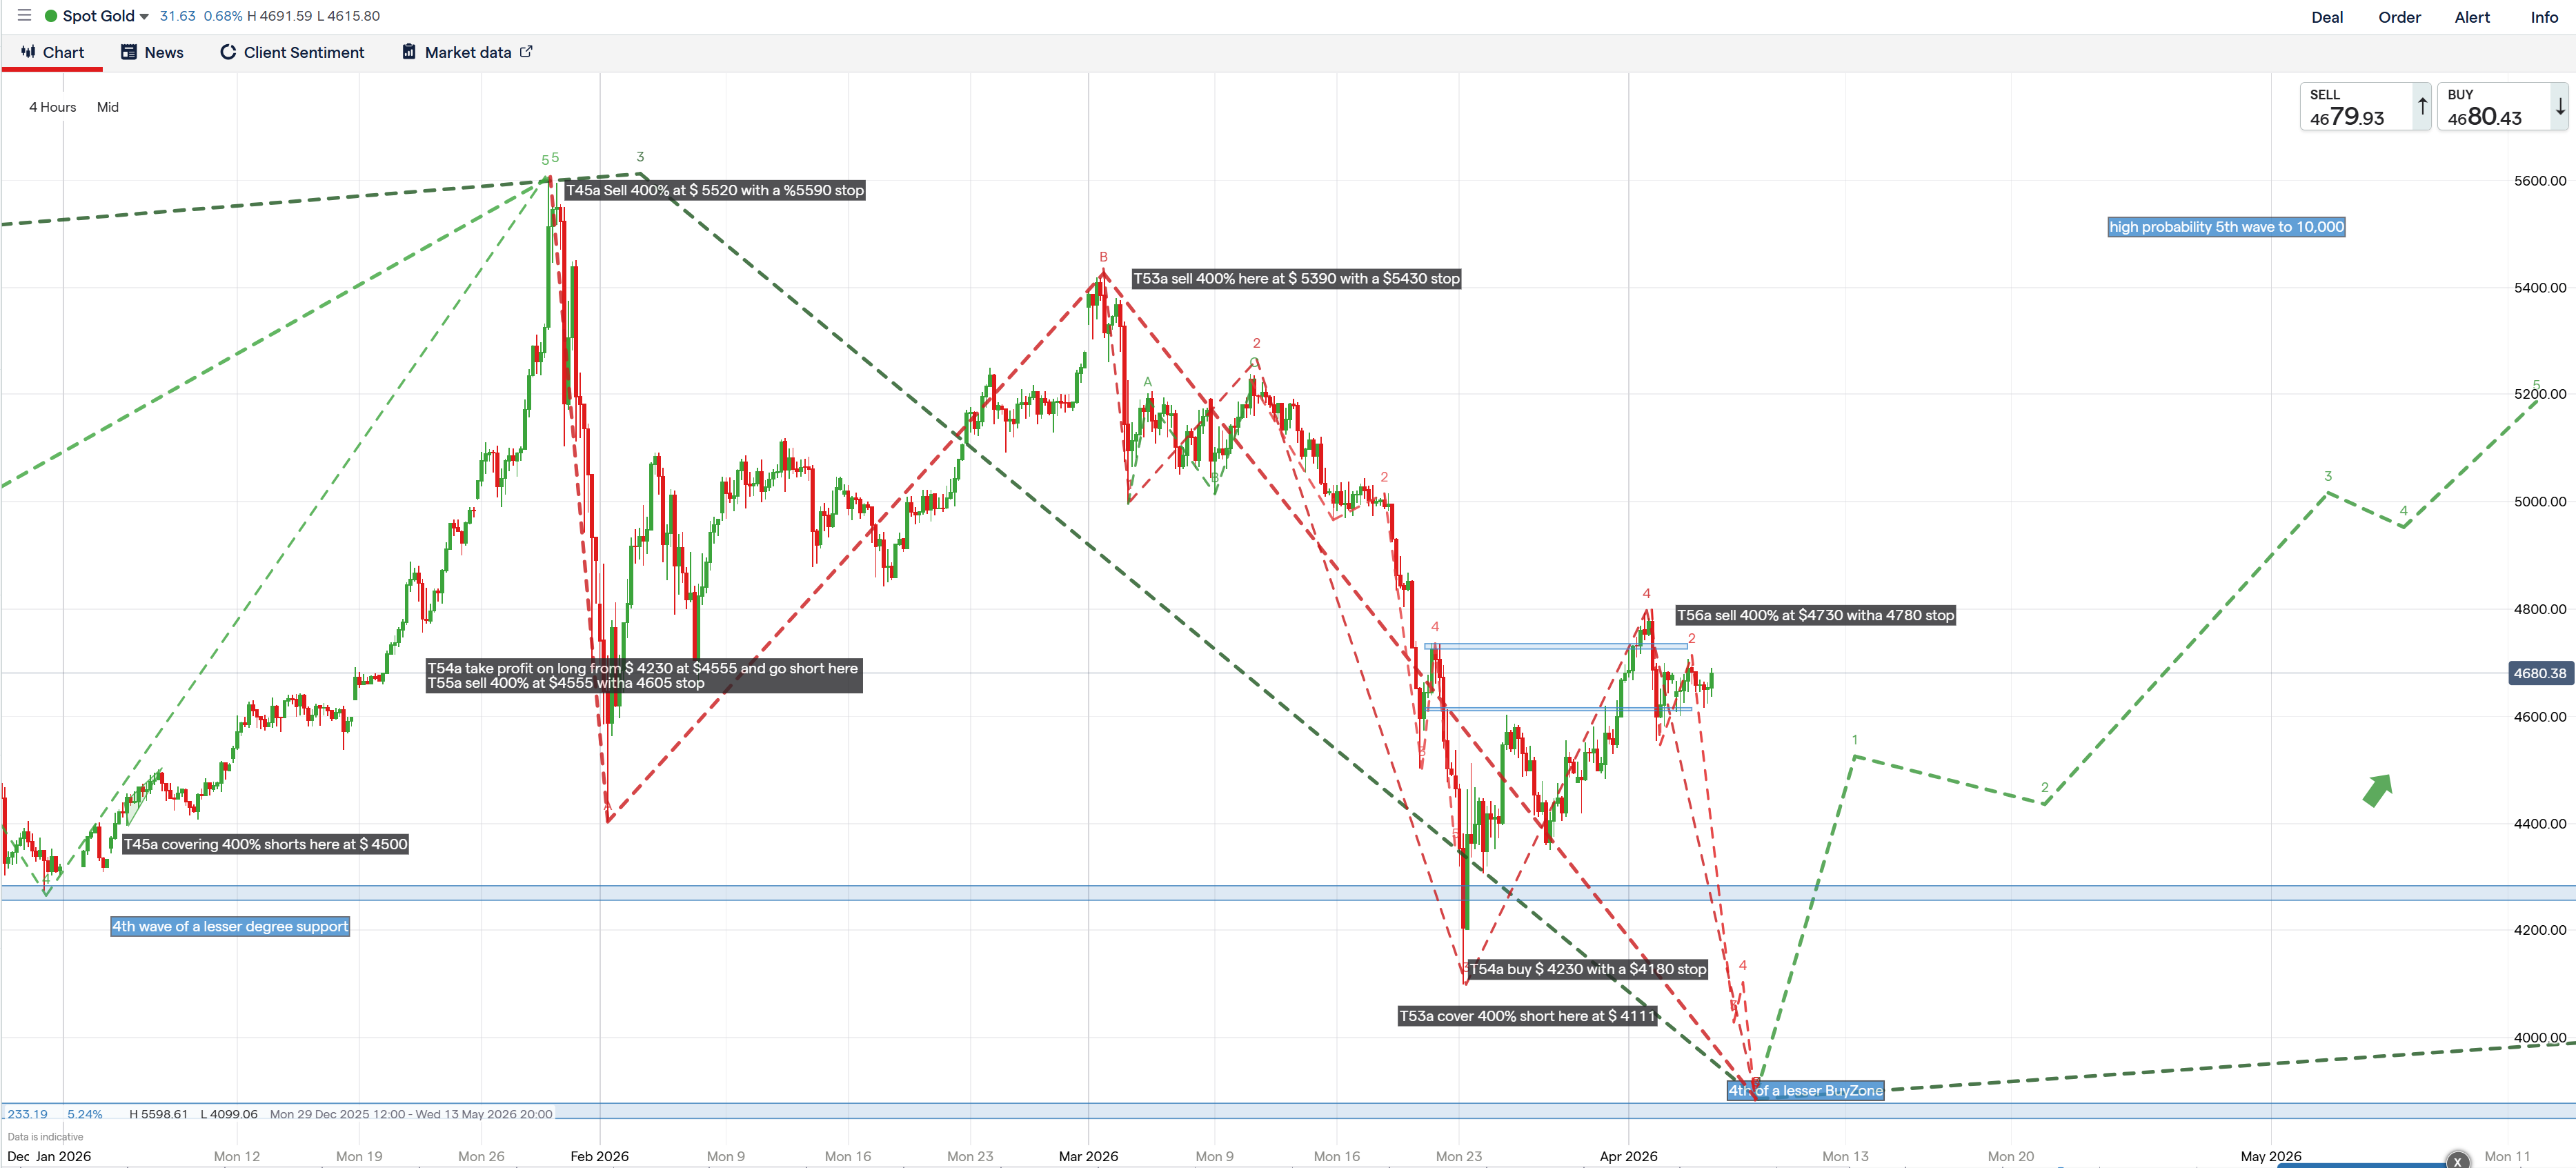
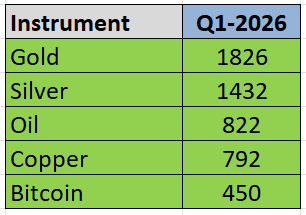
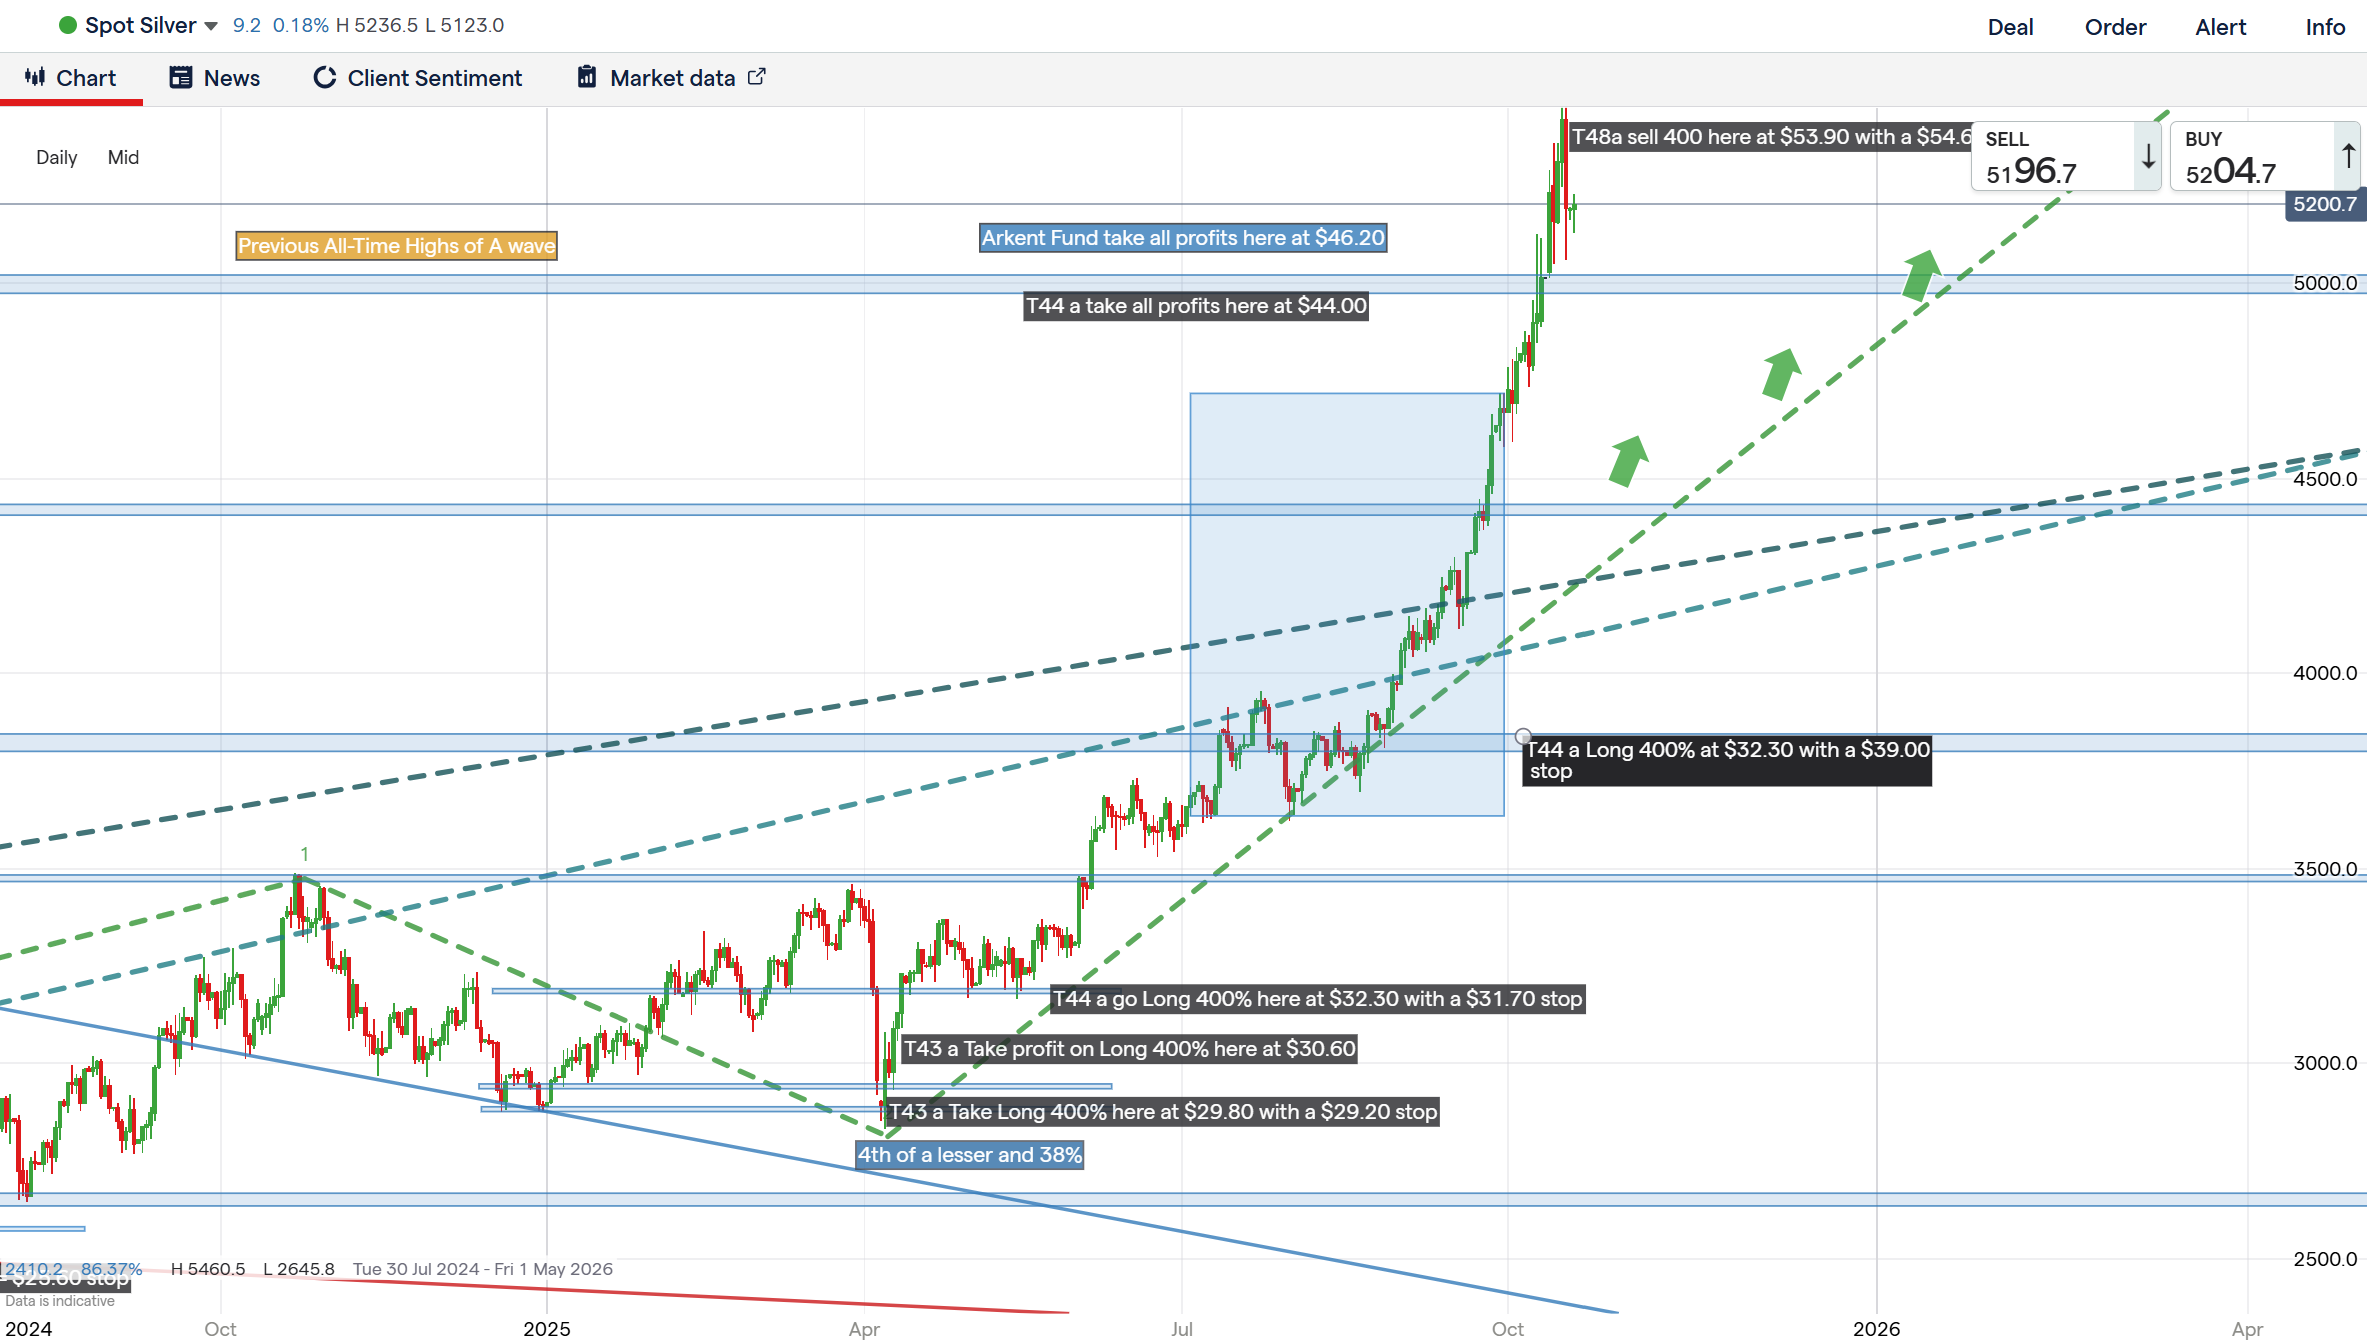
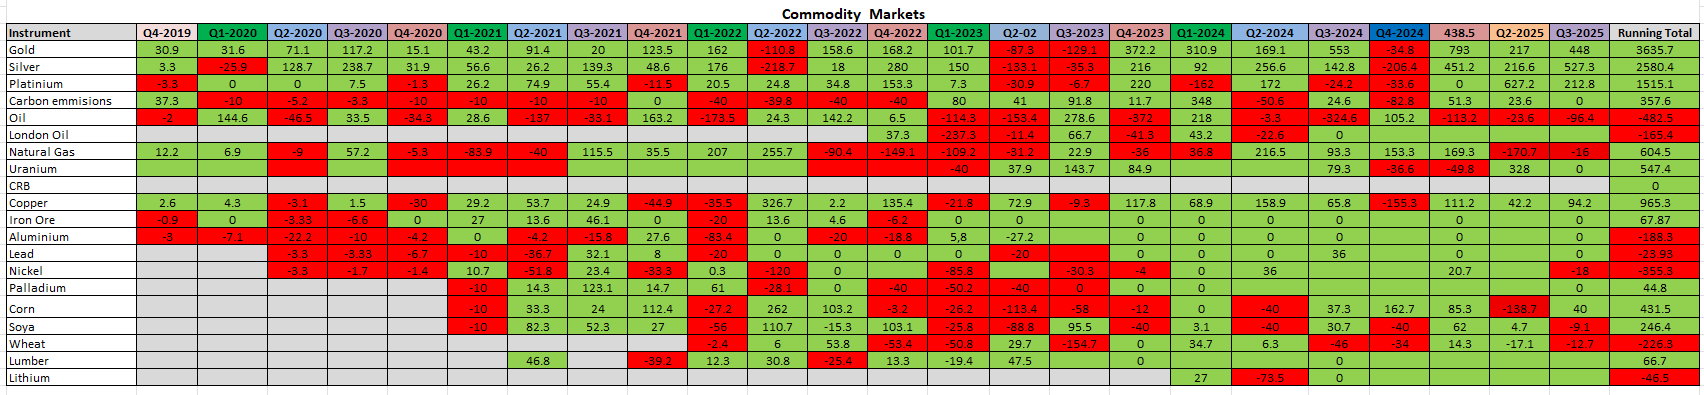
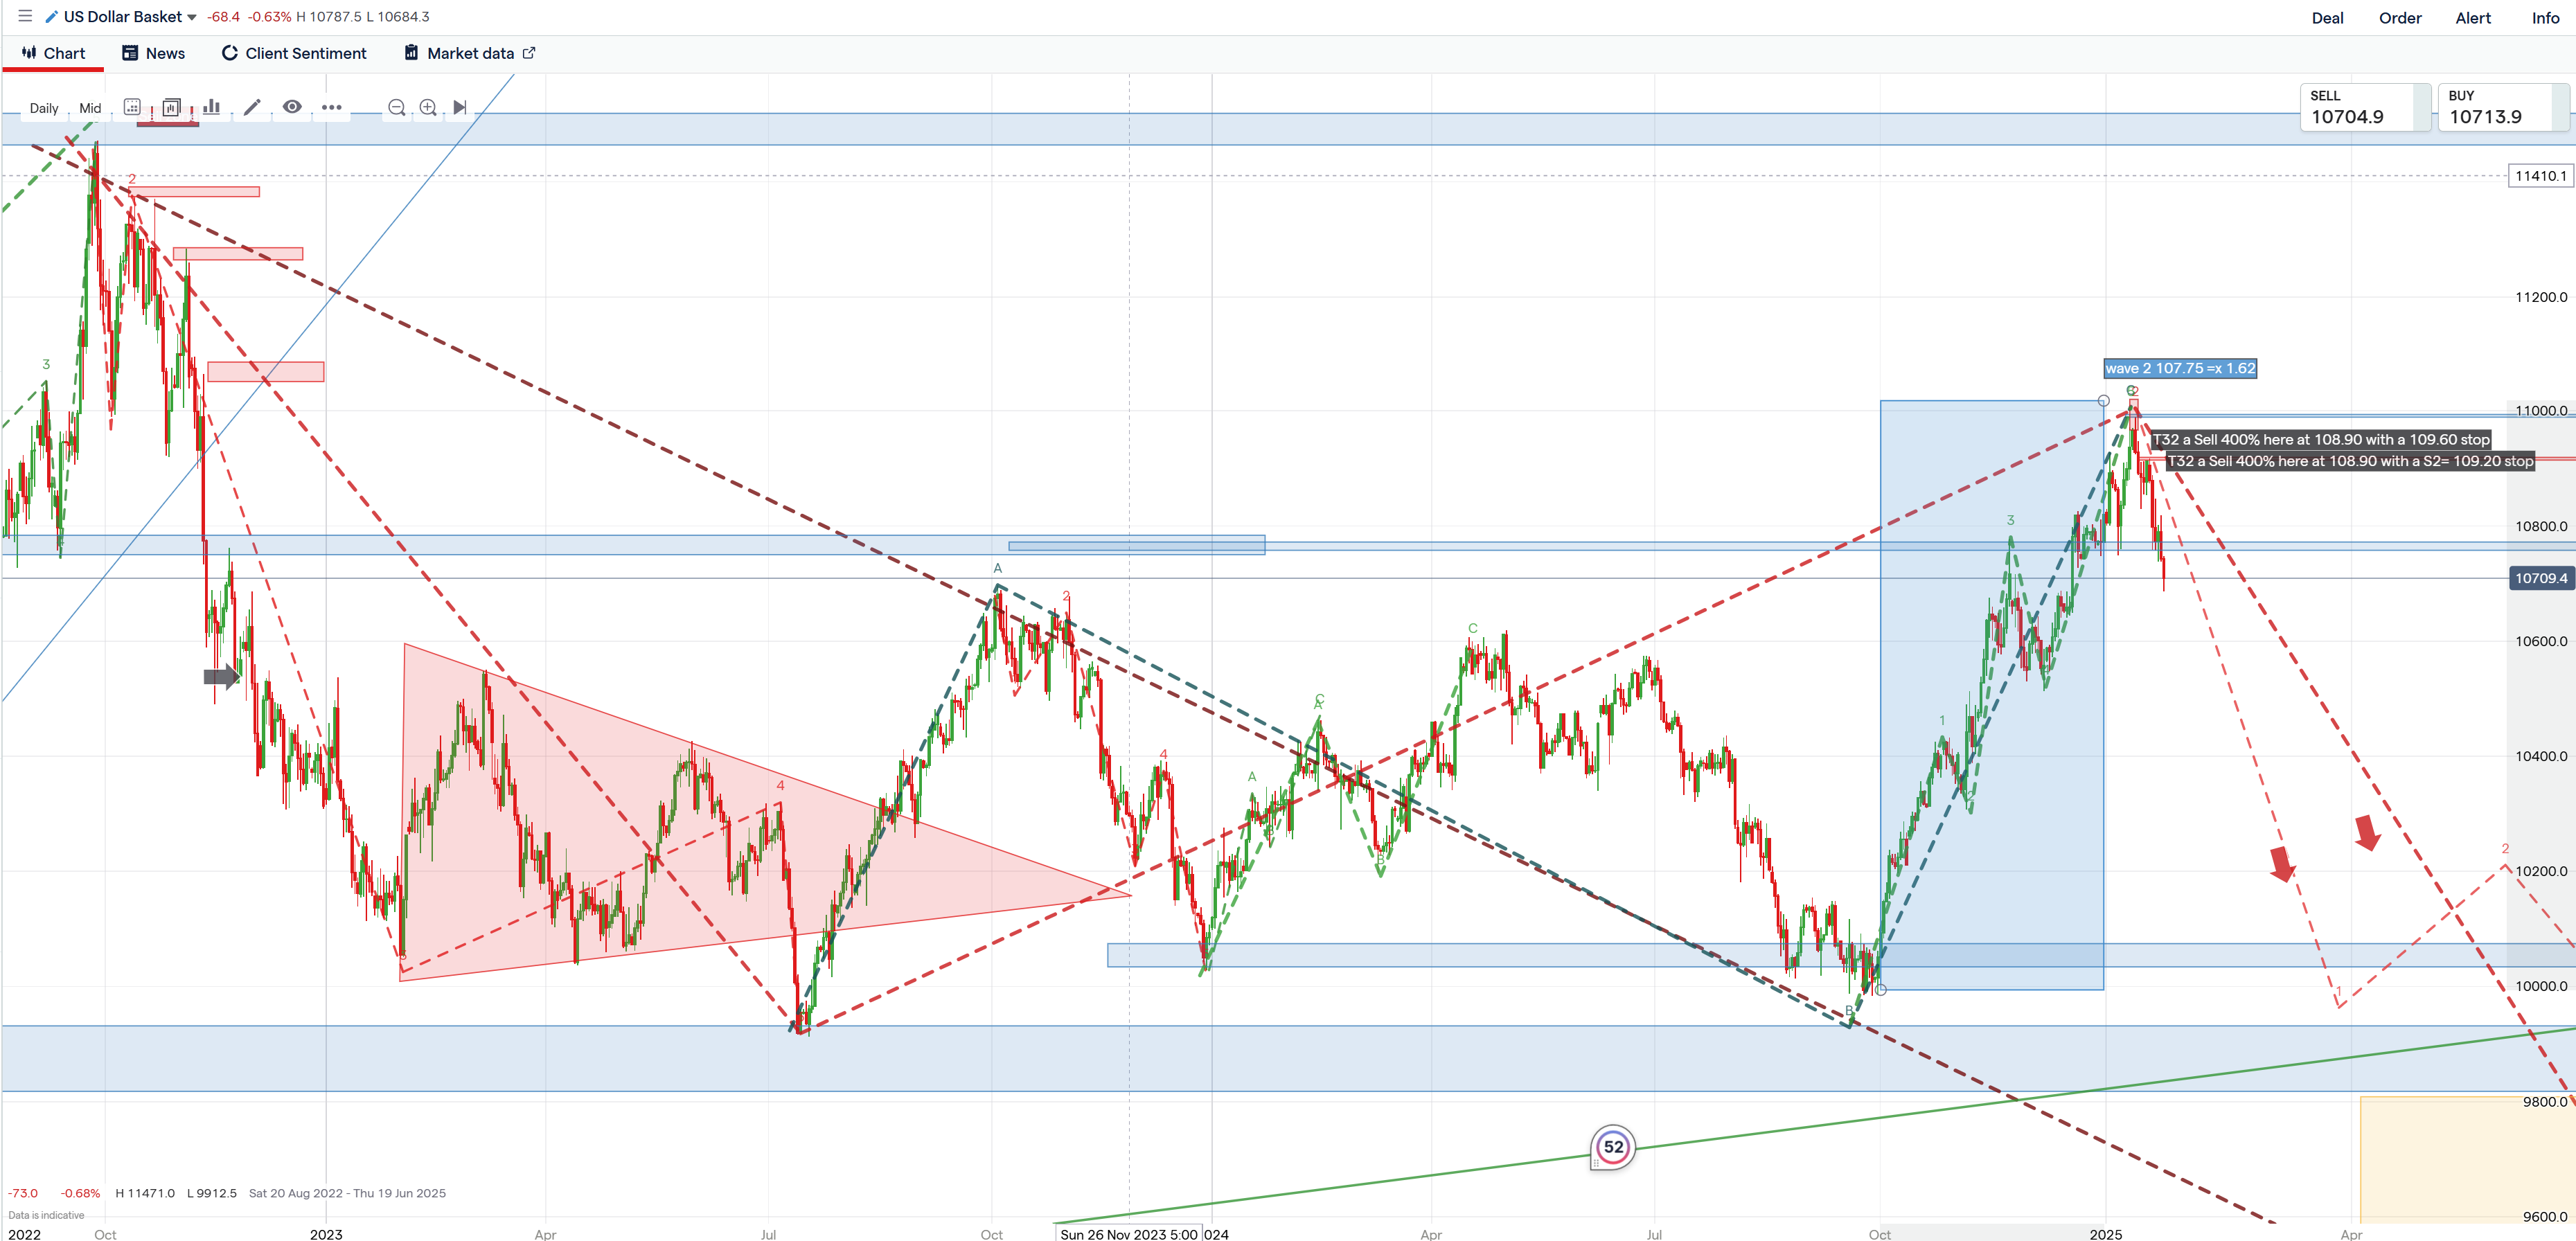
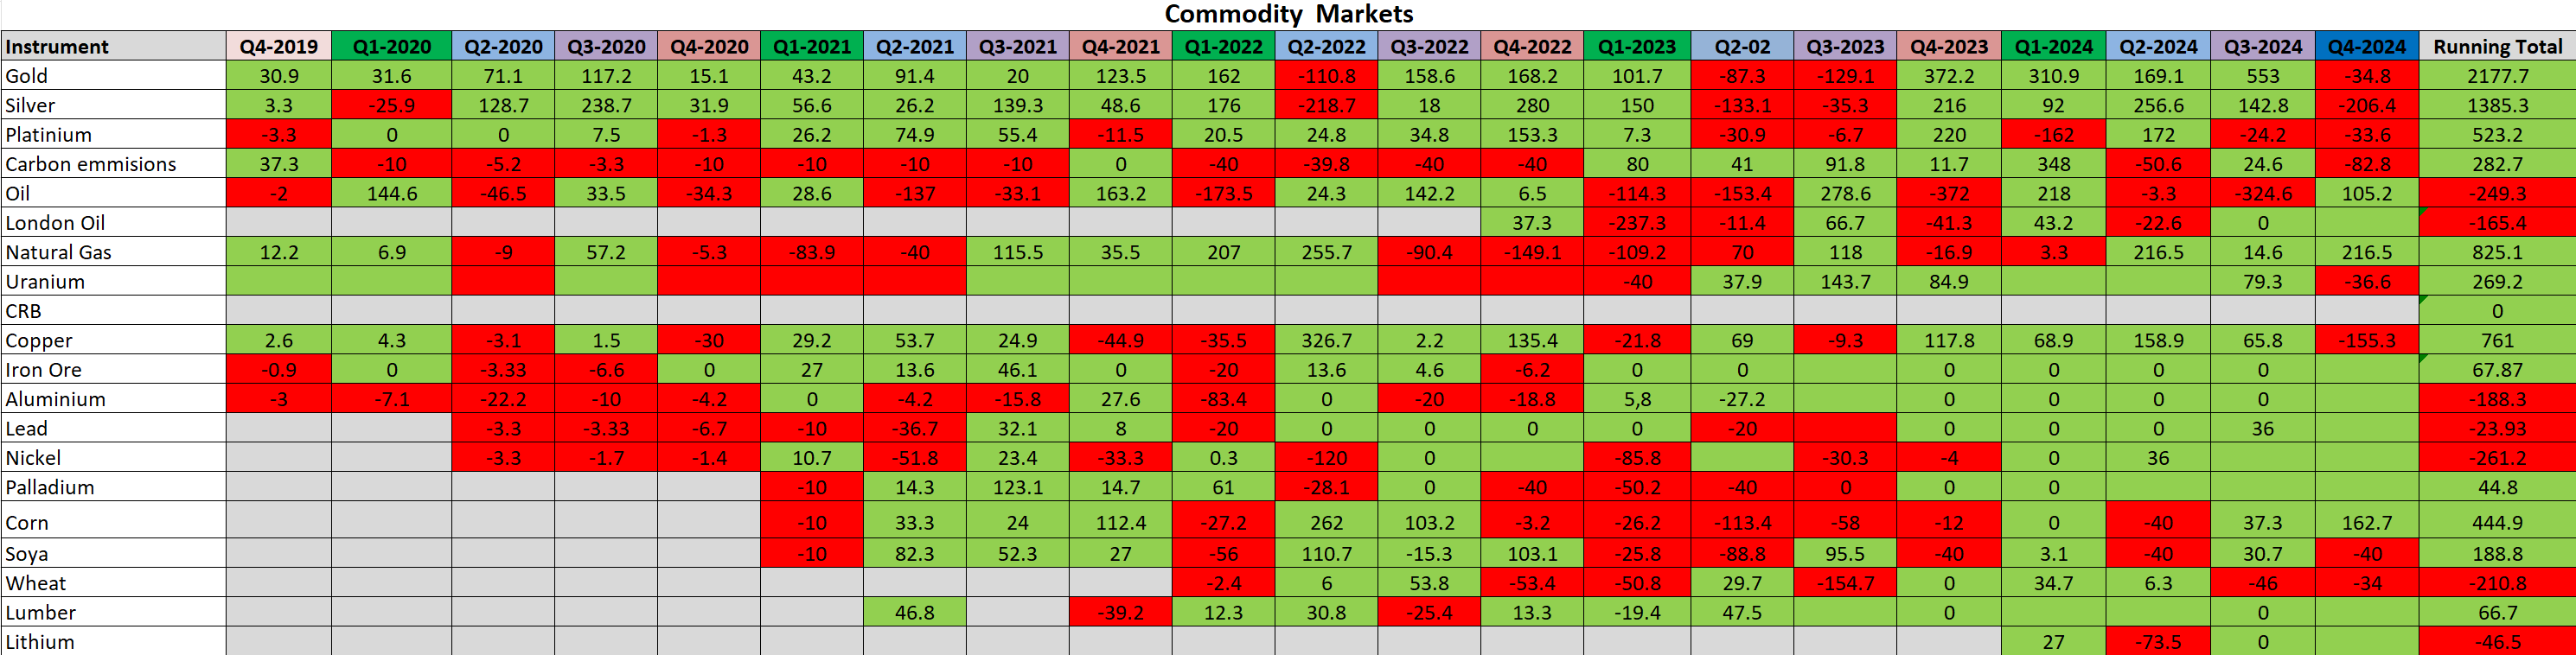
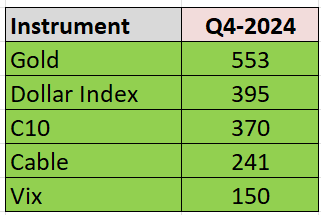
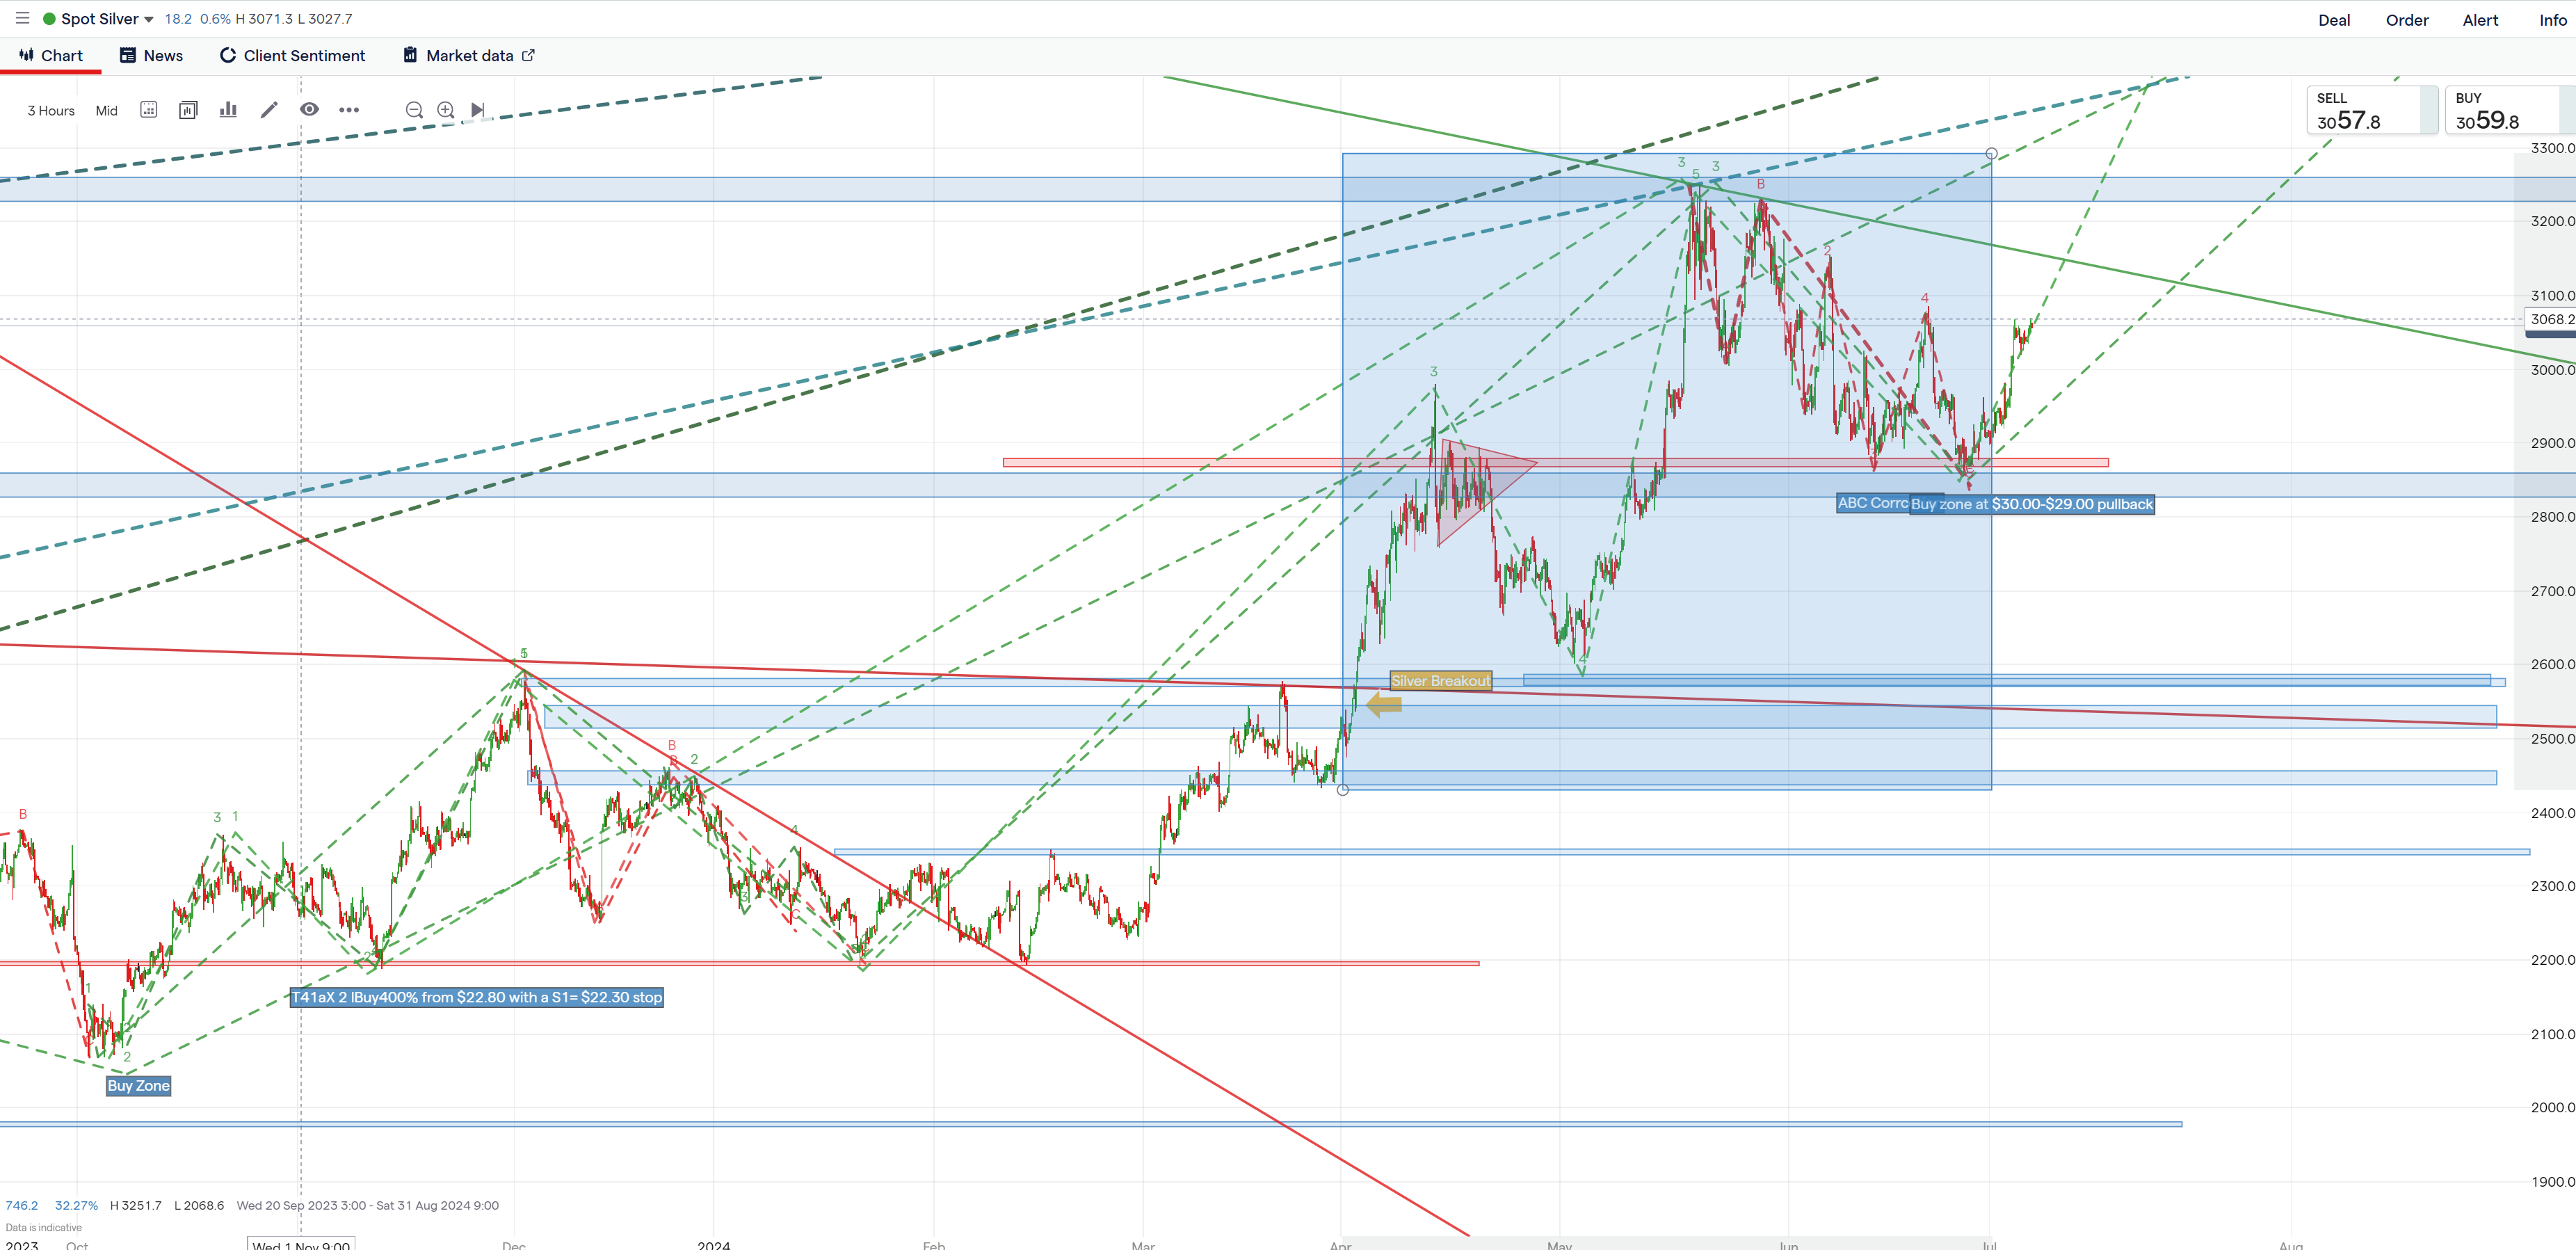
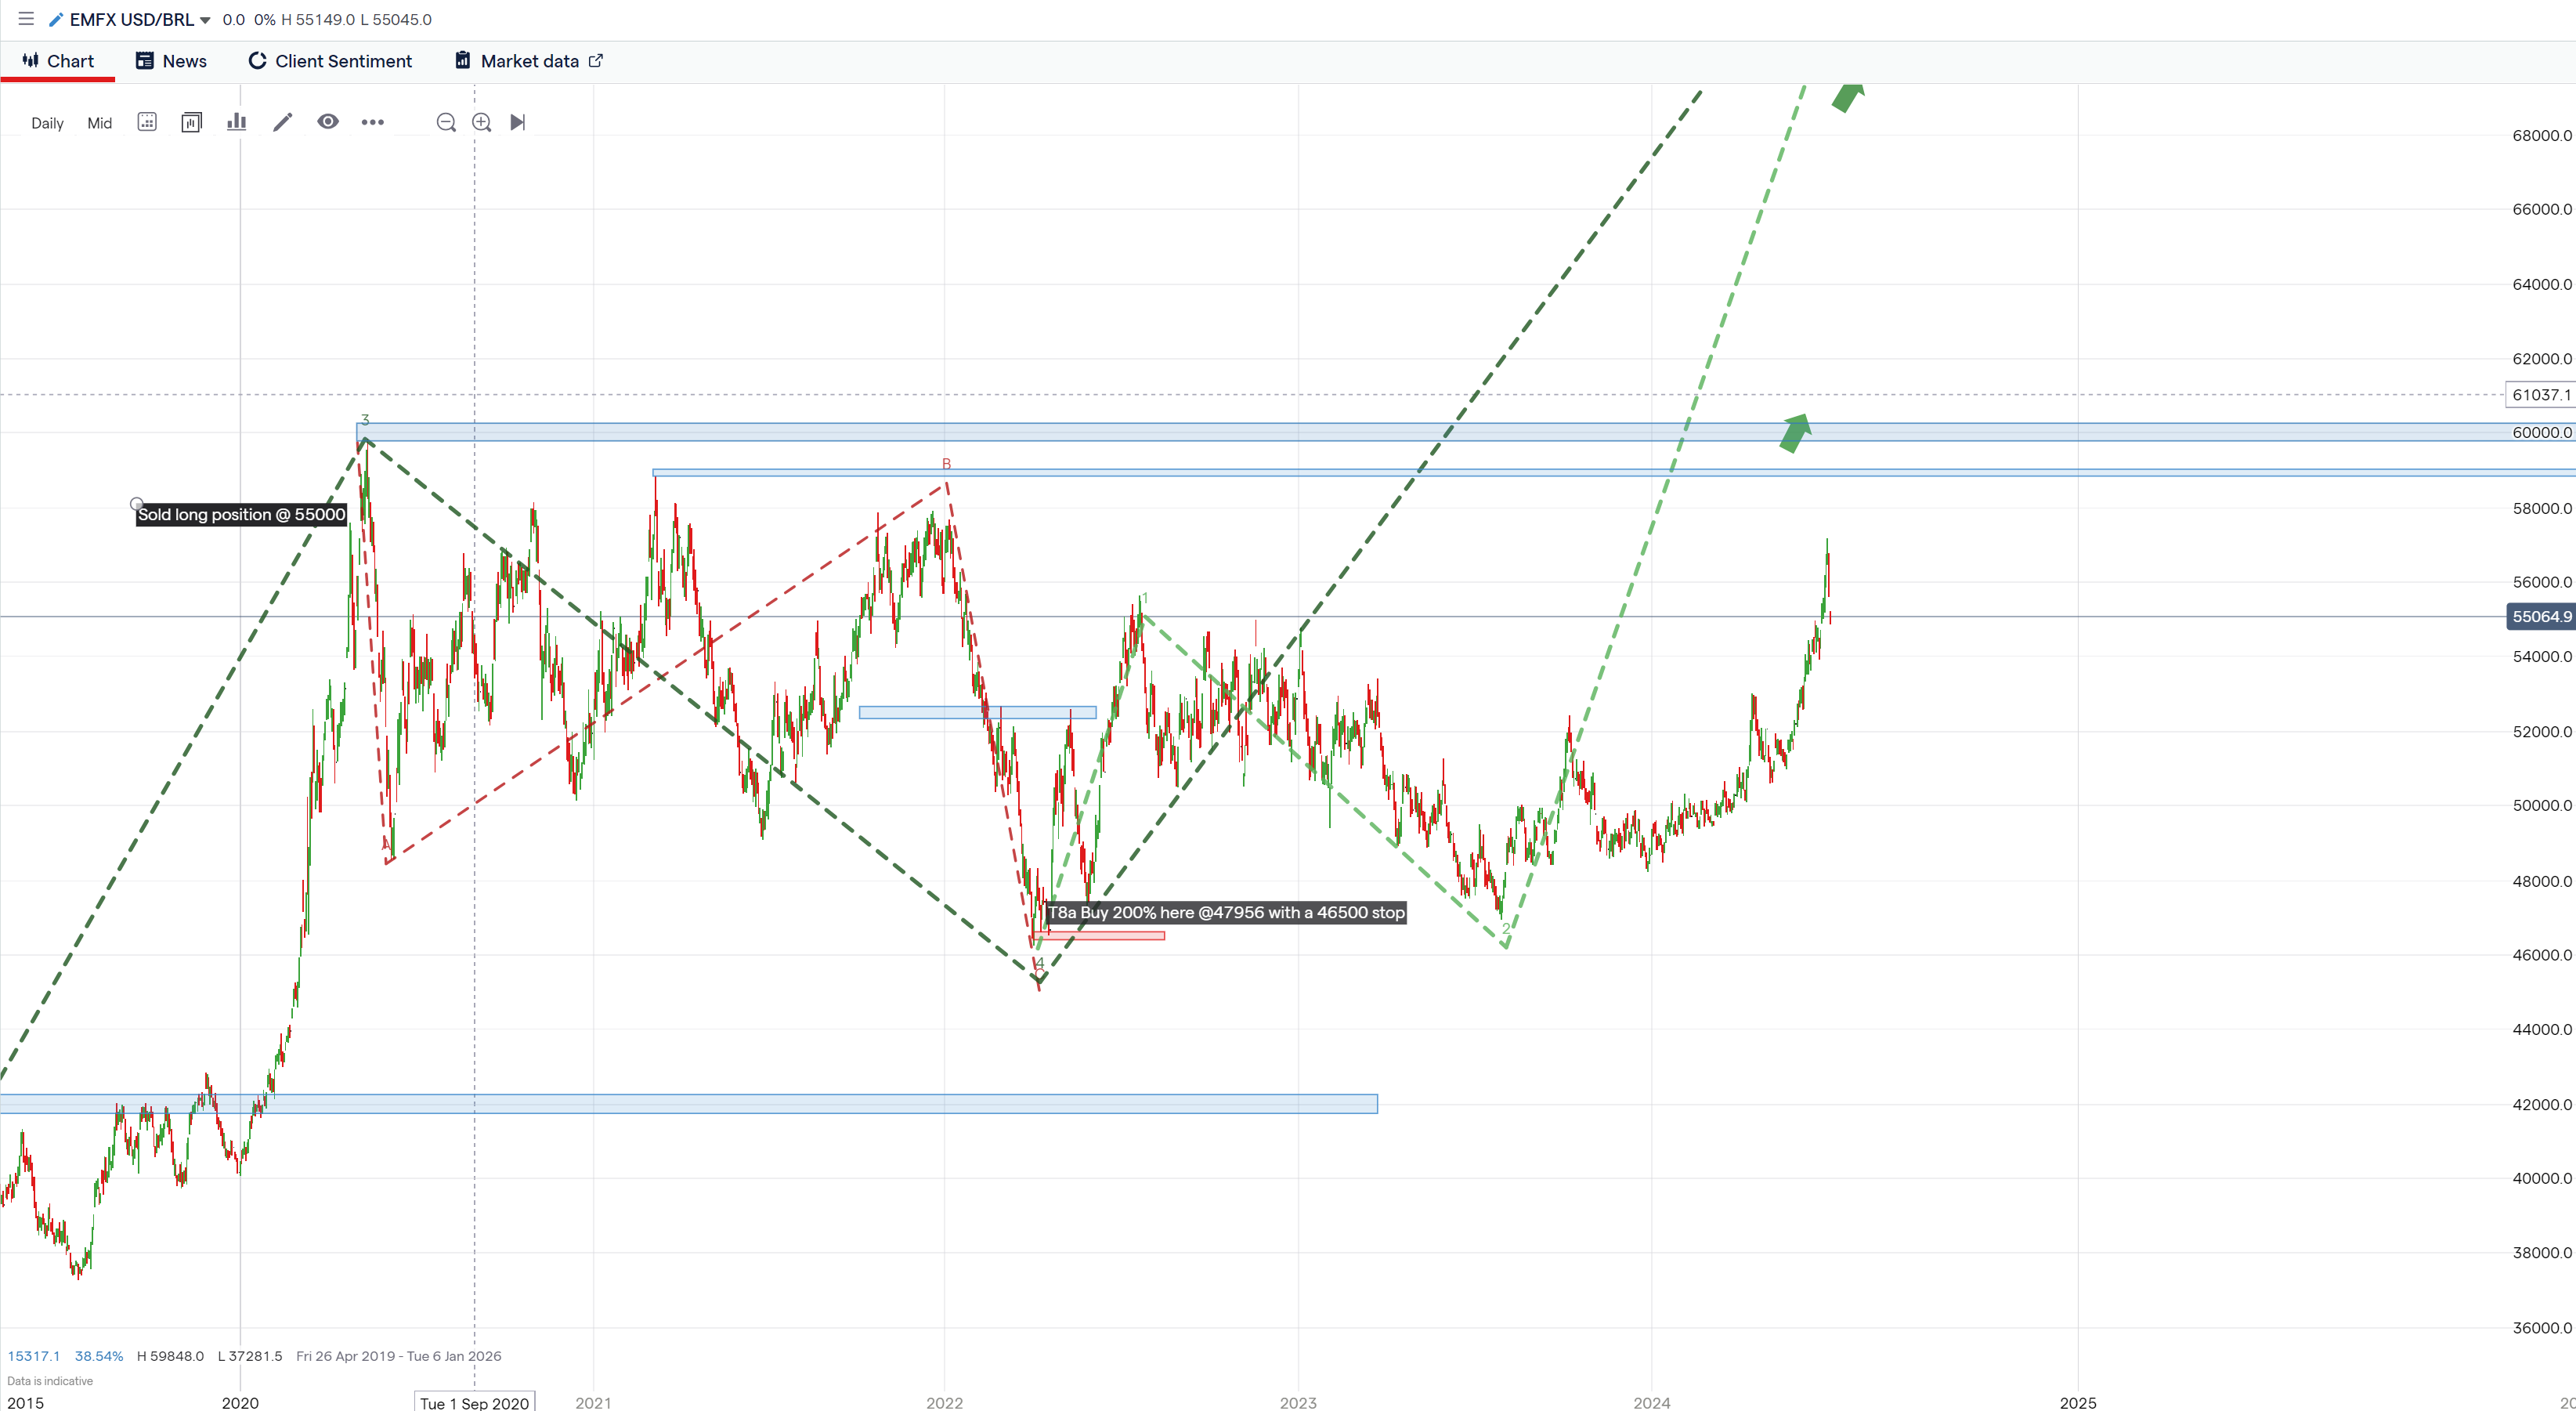
The below table shows an example of a supermax long gold trade entered at the lows which as part of our major play within our precious metals strategy
- Numbers T16a to T 16c refer to 3 separate trade entry points 100% +100%+200% to make a total 400% sized trade
- Over 8 quarters up to the end of Q320, gold has made over 420 trade units (trade sizes are normally from (33%) =3.3 units to (200%)= 20units. Only once in 12 months or so would we make a (400%)40 unit recommendation, like the one in play at the moment.
- Note that the market to market (in yellow) recommendation T16a to c is up 300 units this quarter-which is a whooper of trade. And makes a total return in gold of 720.5 units 40 unit over 8.5 quarters.
Image

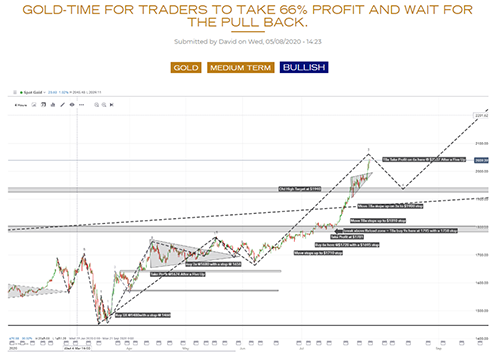
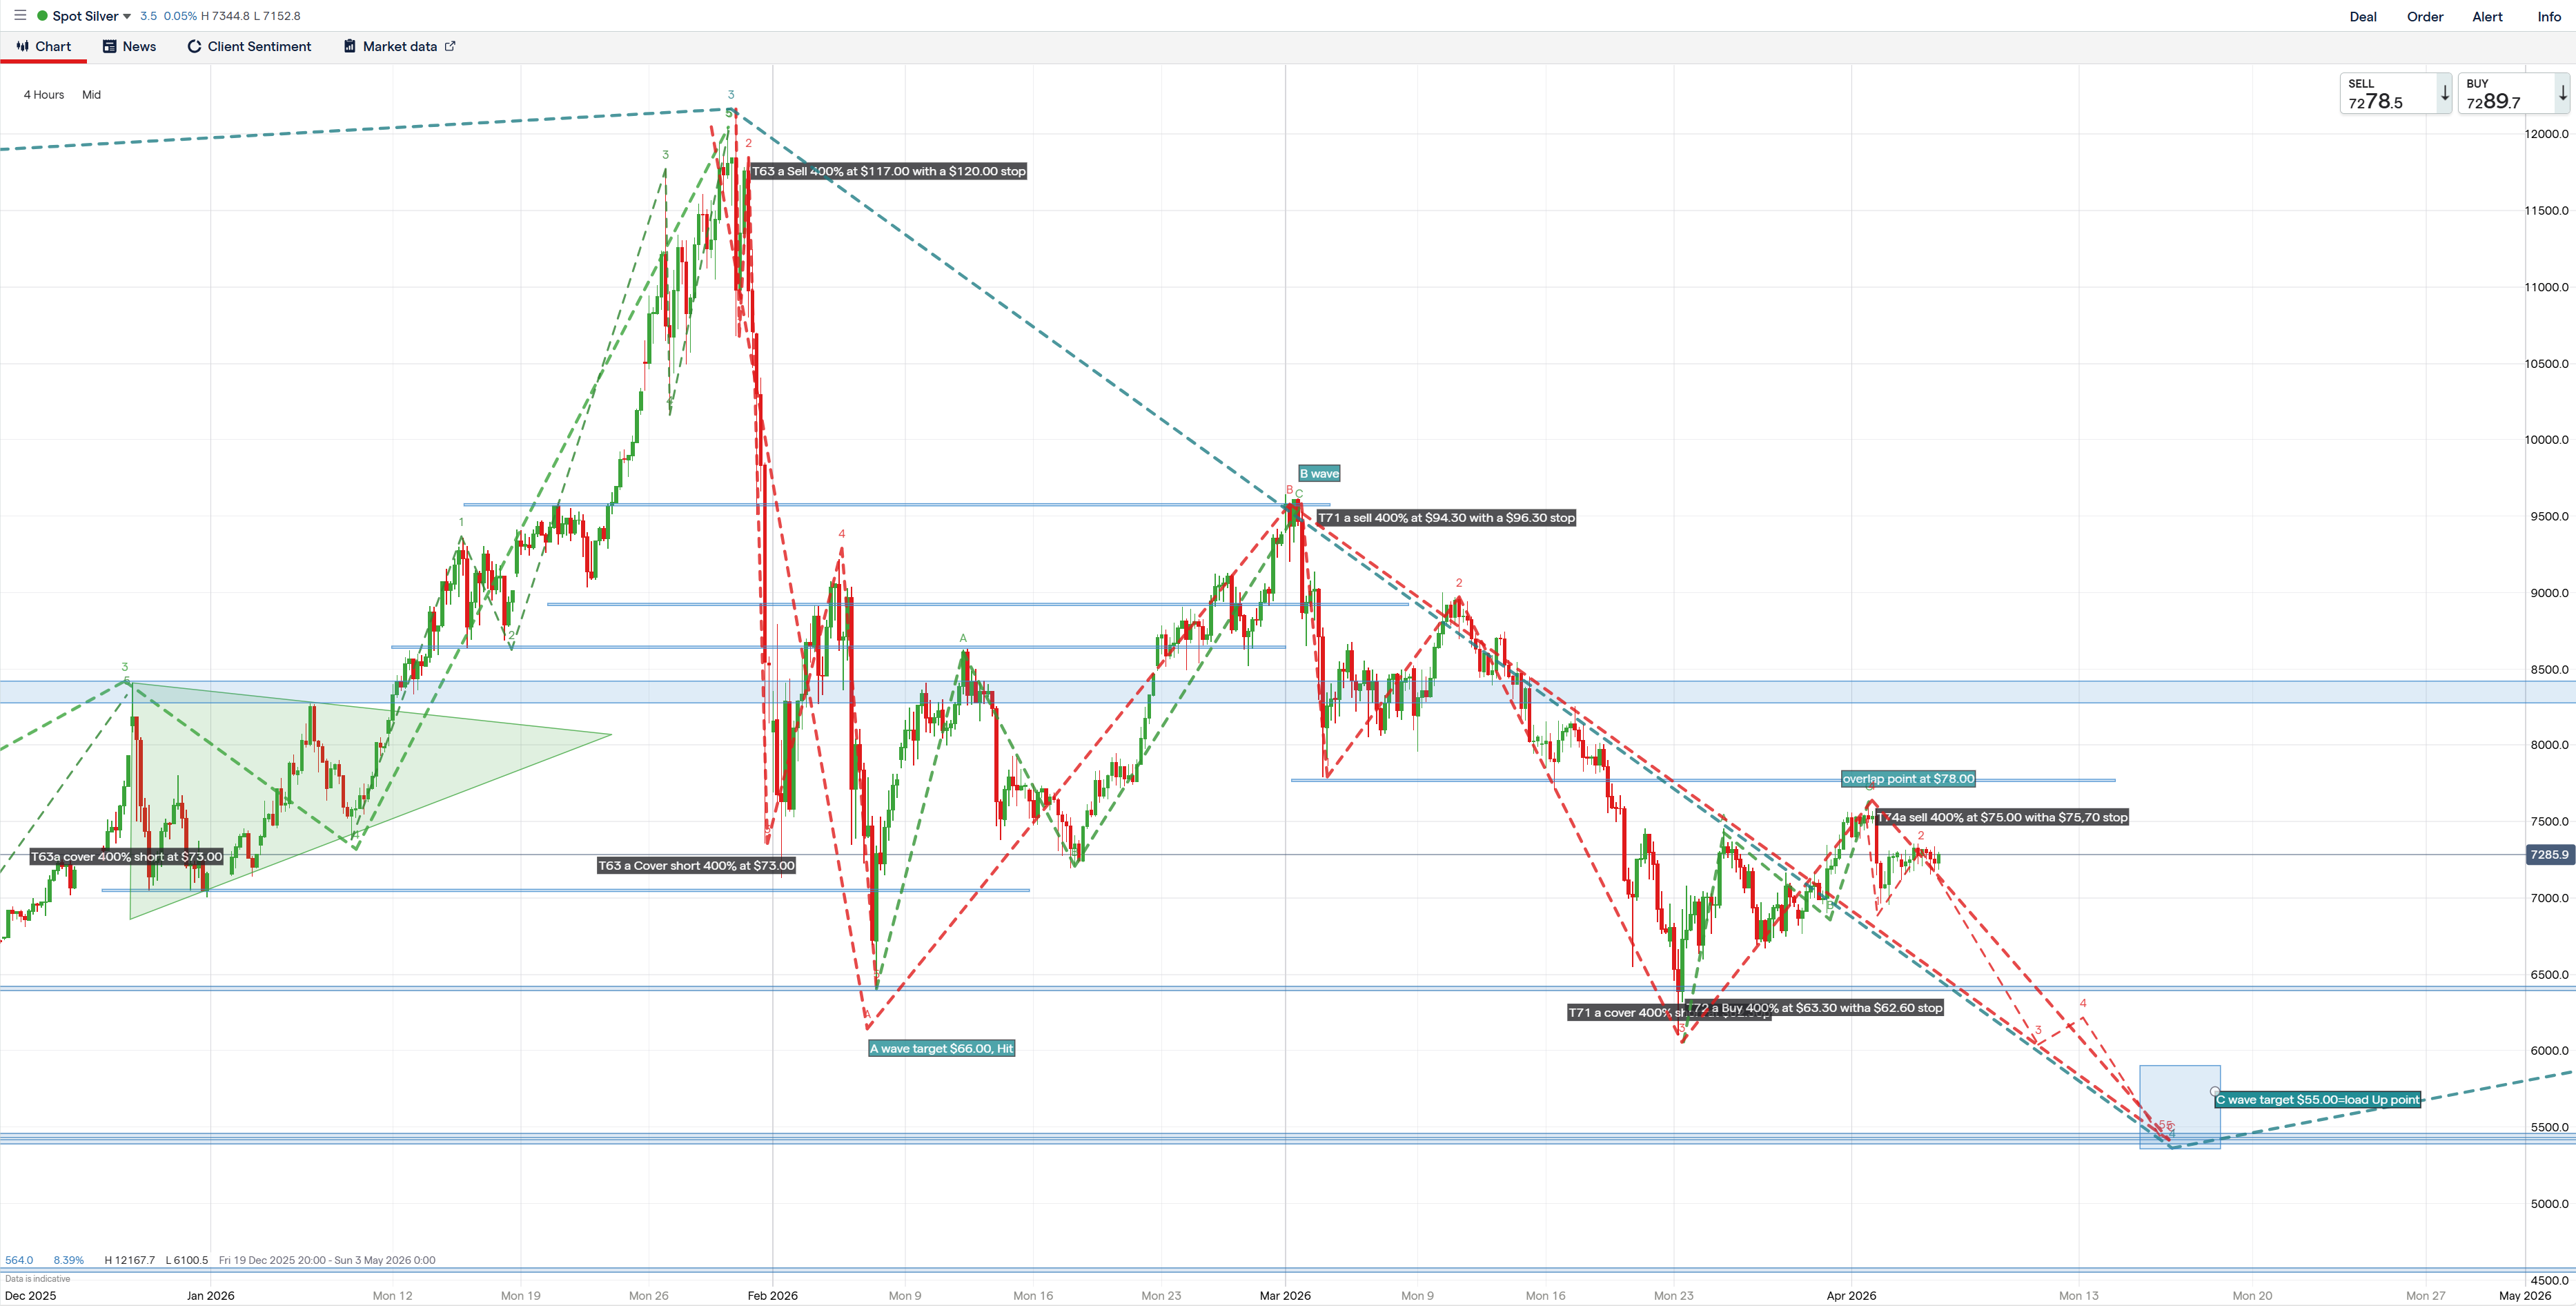
For Silver, the returns were even greater.
- Over 8 quarters up to the end of Q320 silver has made over 598 trade units
- Note that the current recommendations T22a,b,c, are now up 386 units for this quarter which makes silver the highest return of all 80 of the macro markest that we trade and track at 985 units over 8.5 quarters.
Image

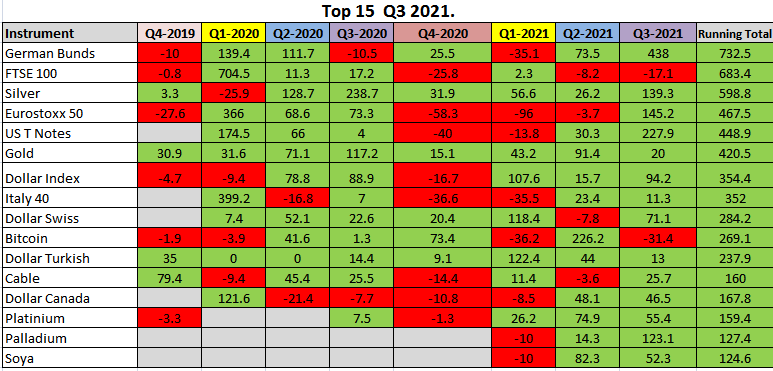
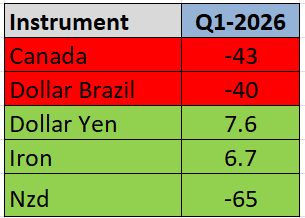
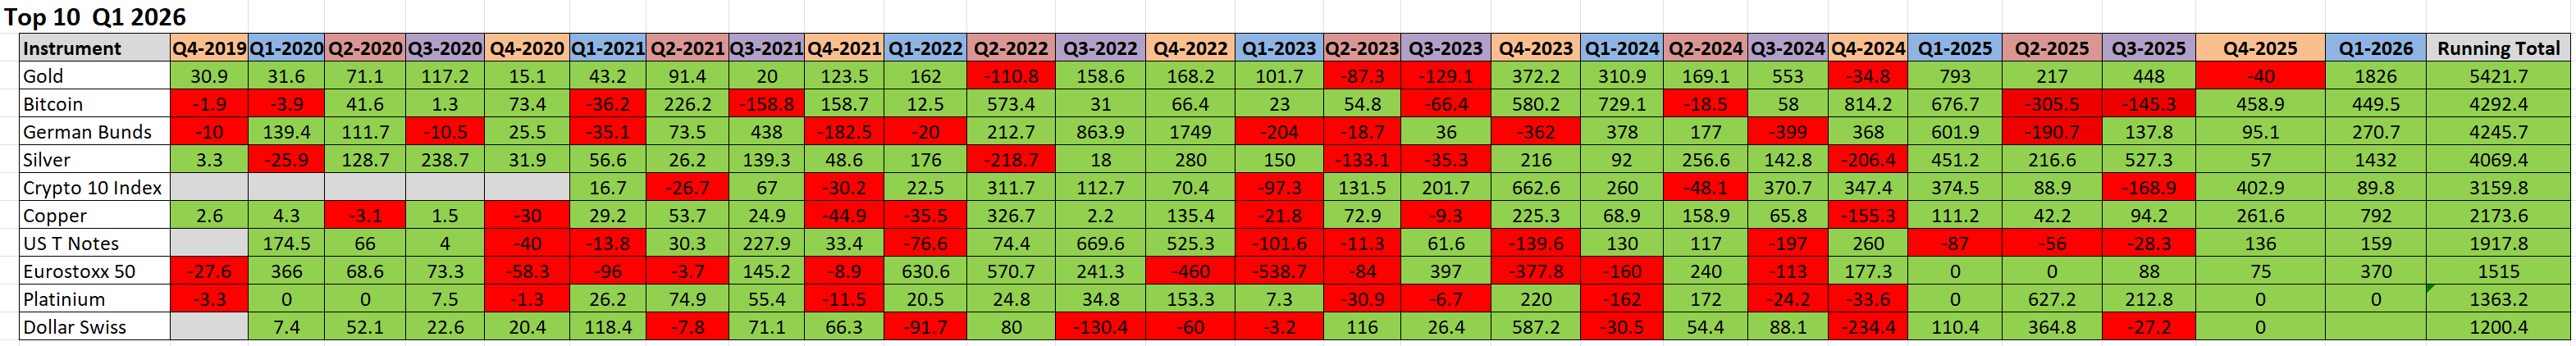
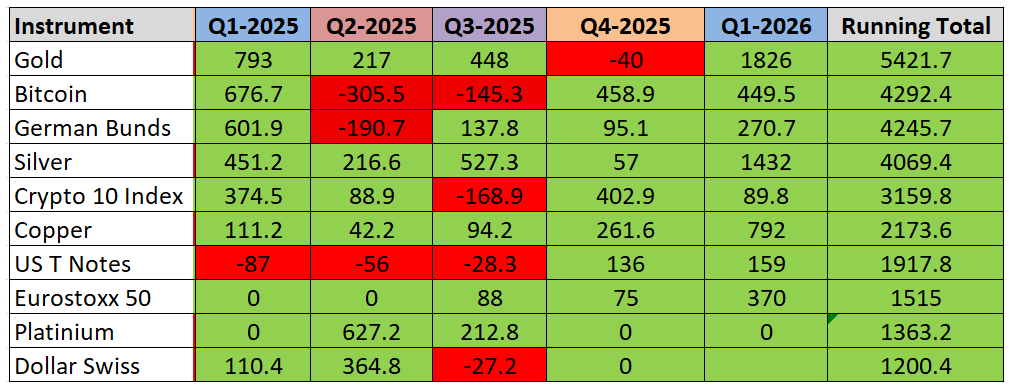
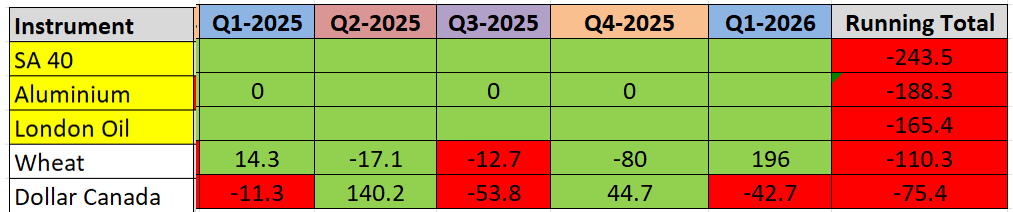
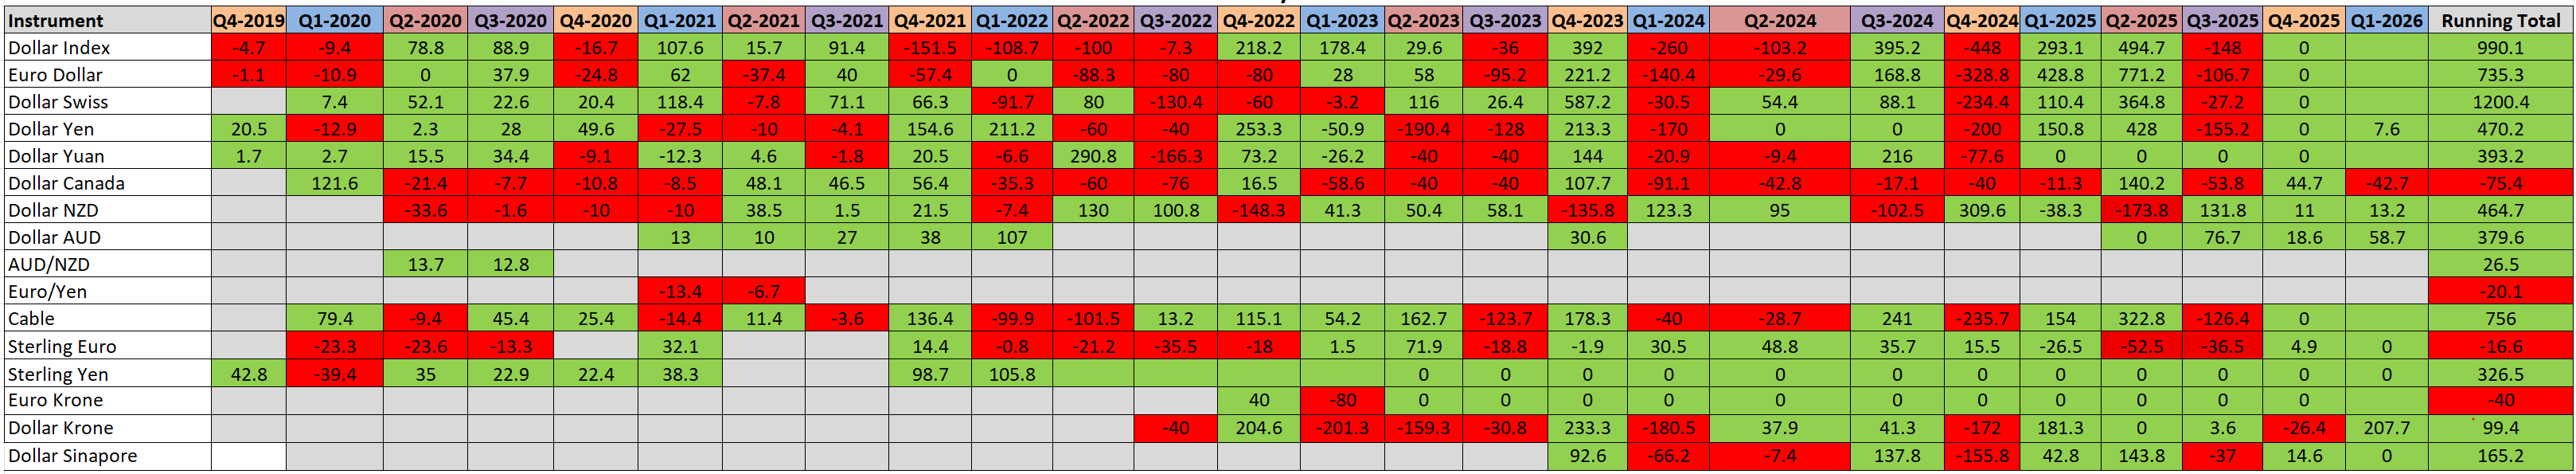
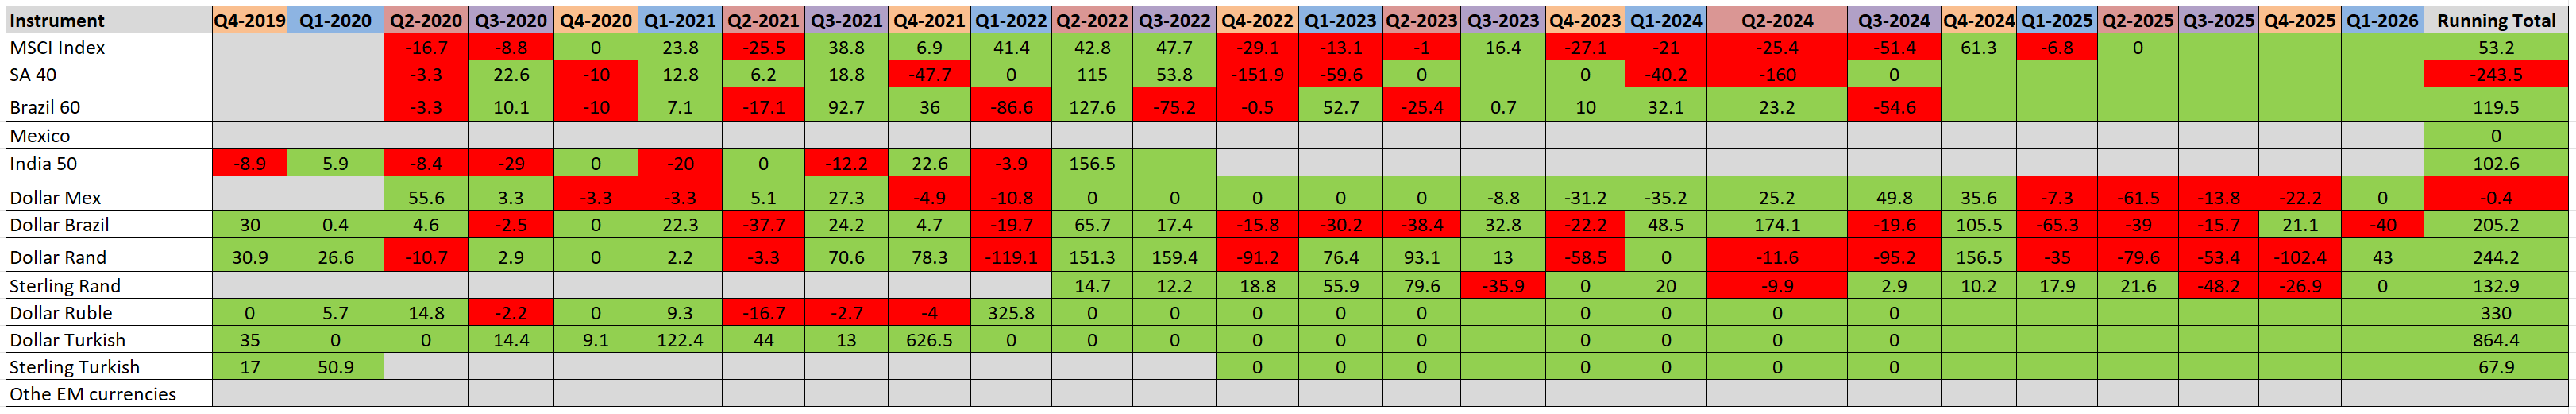
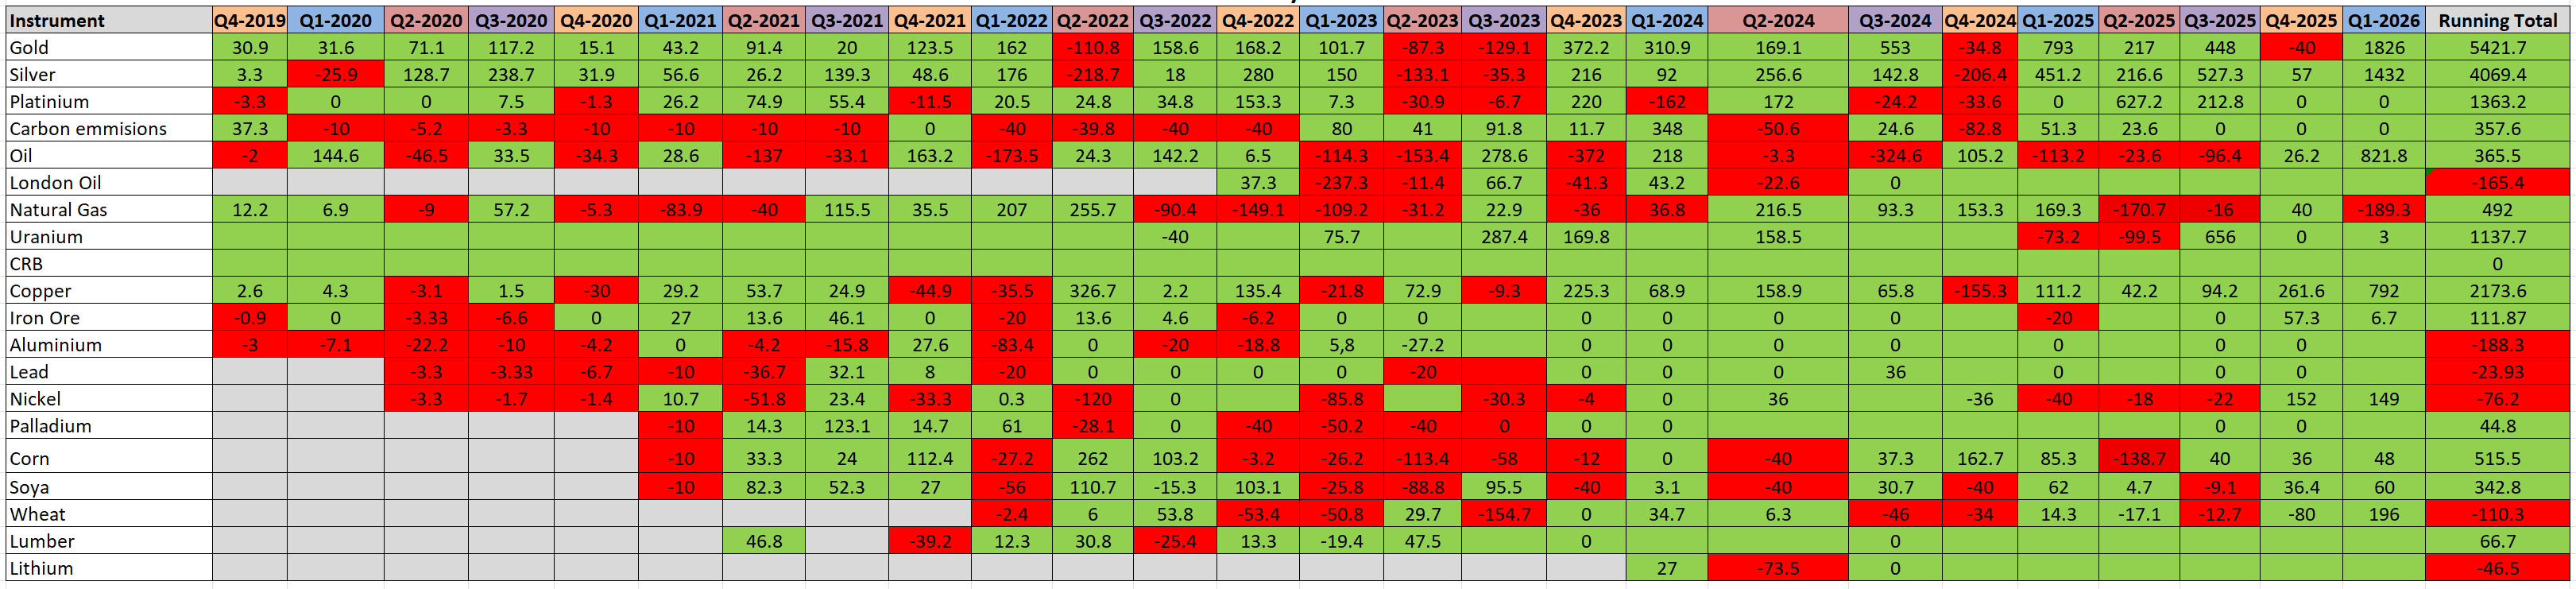
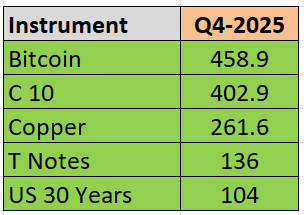
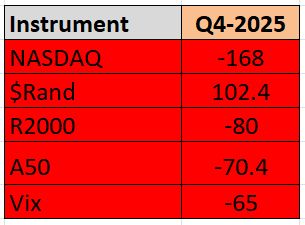
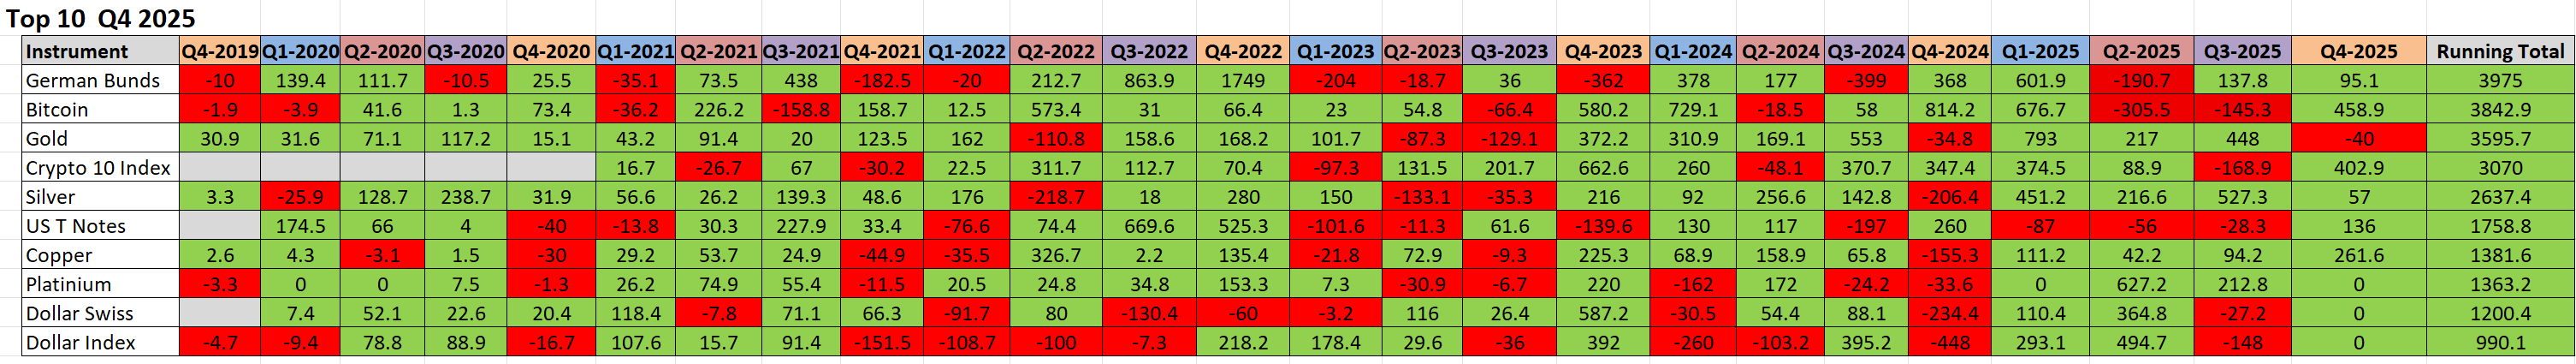
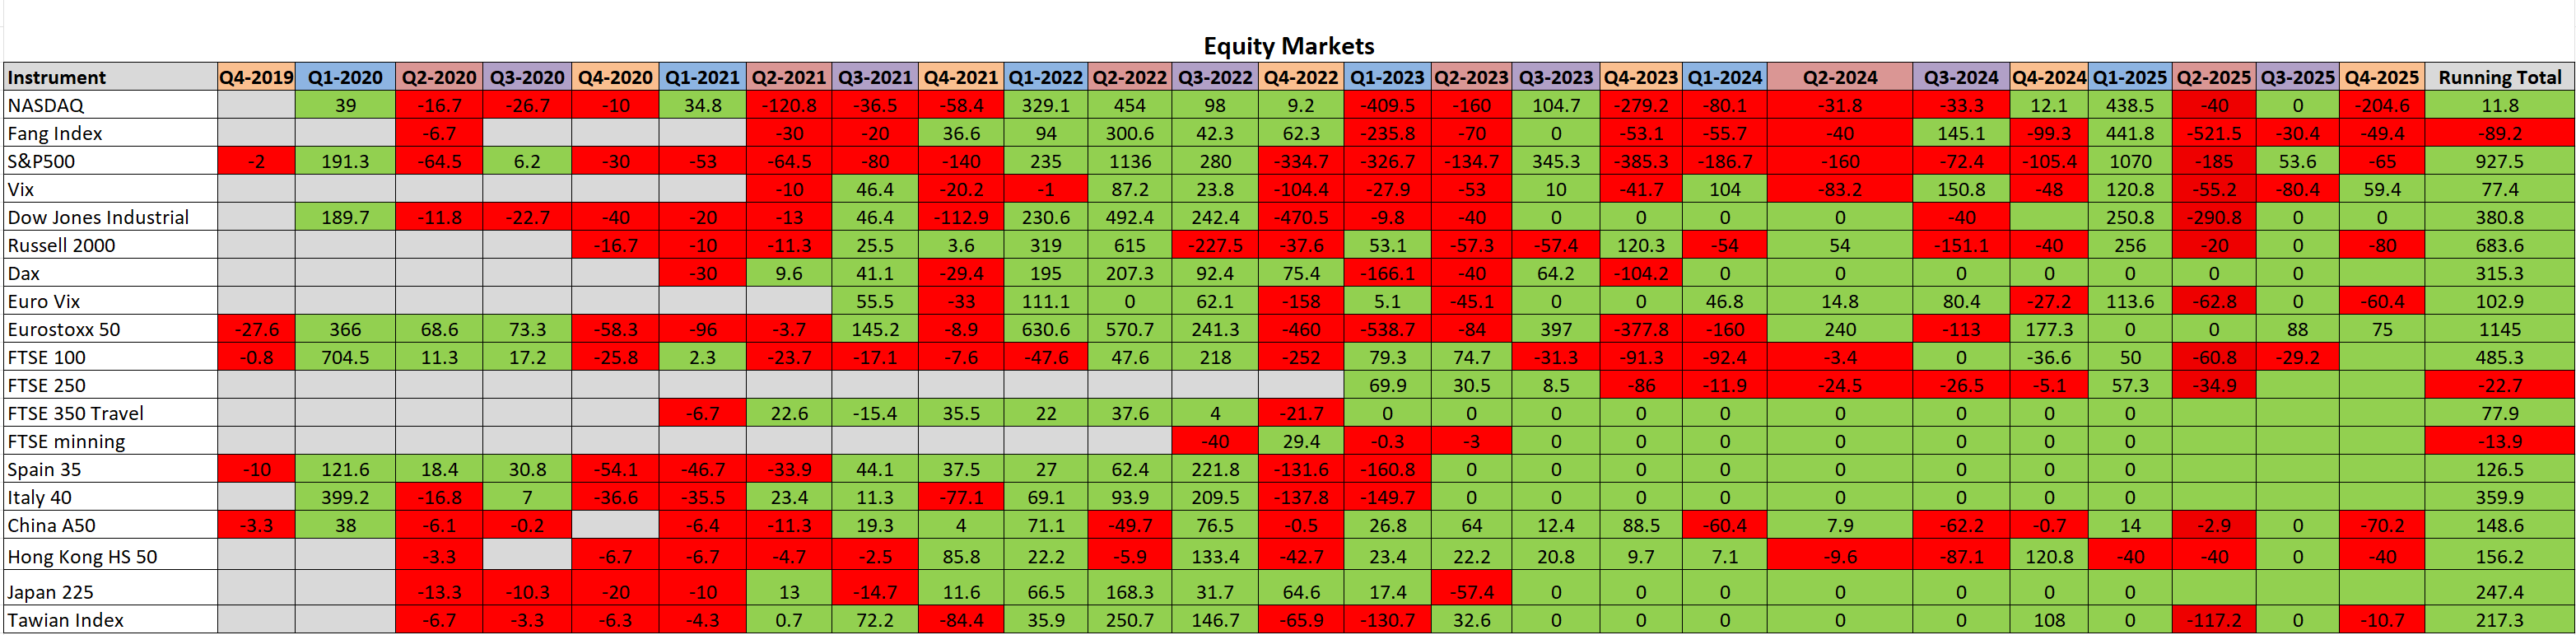
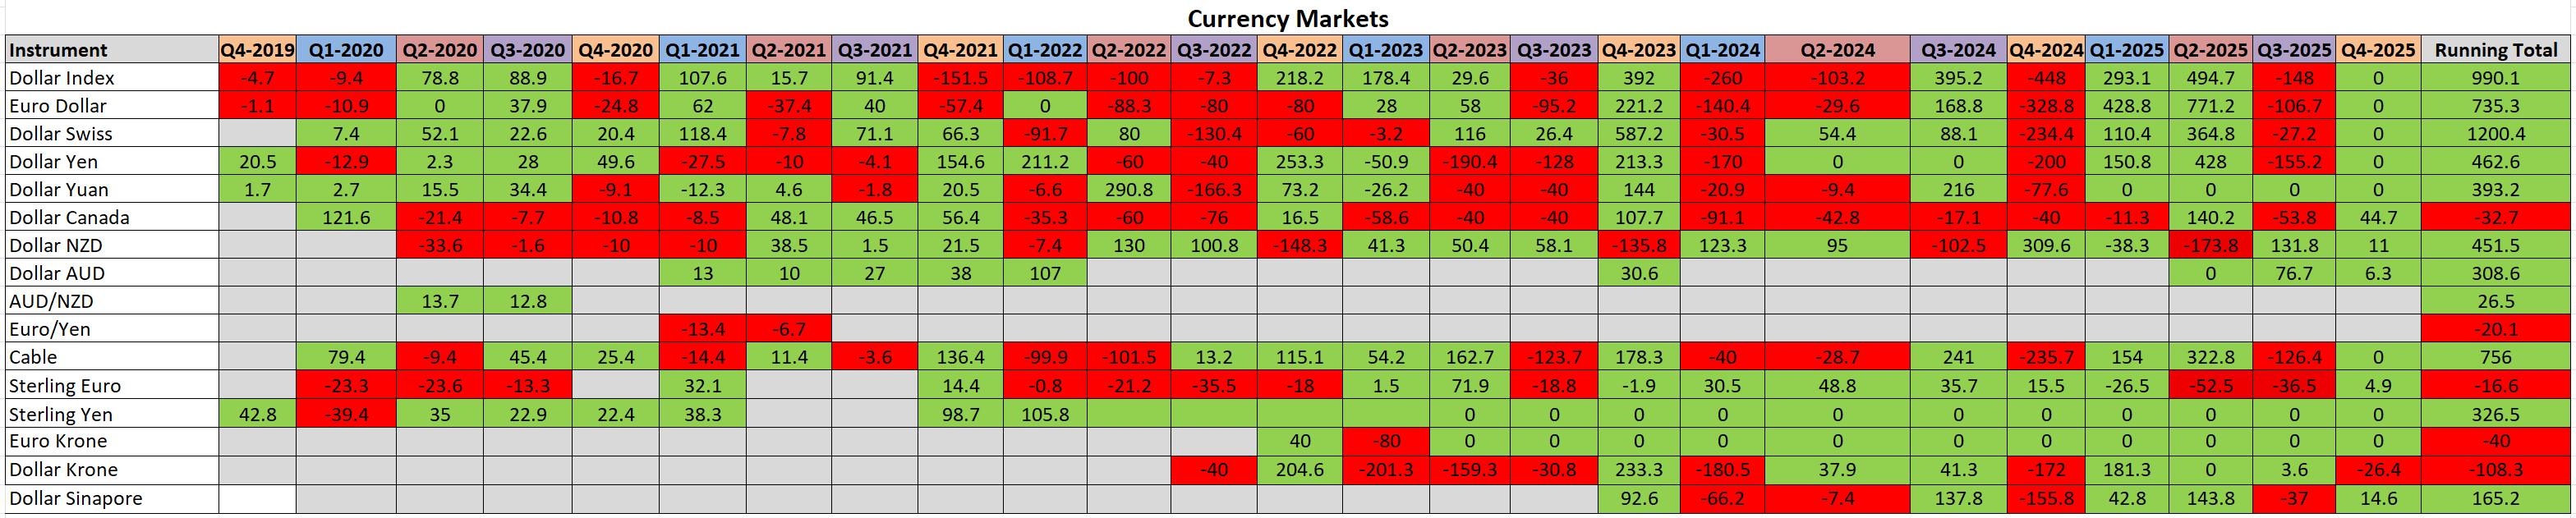
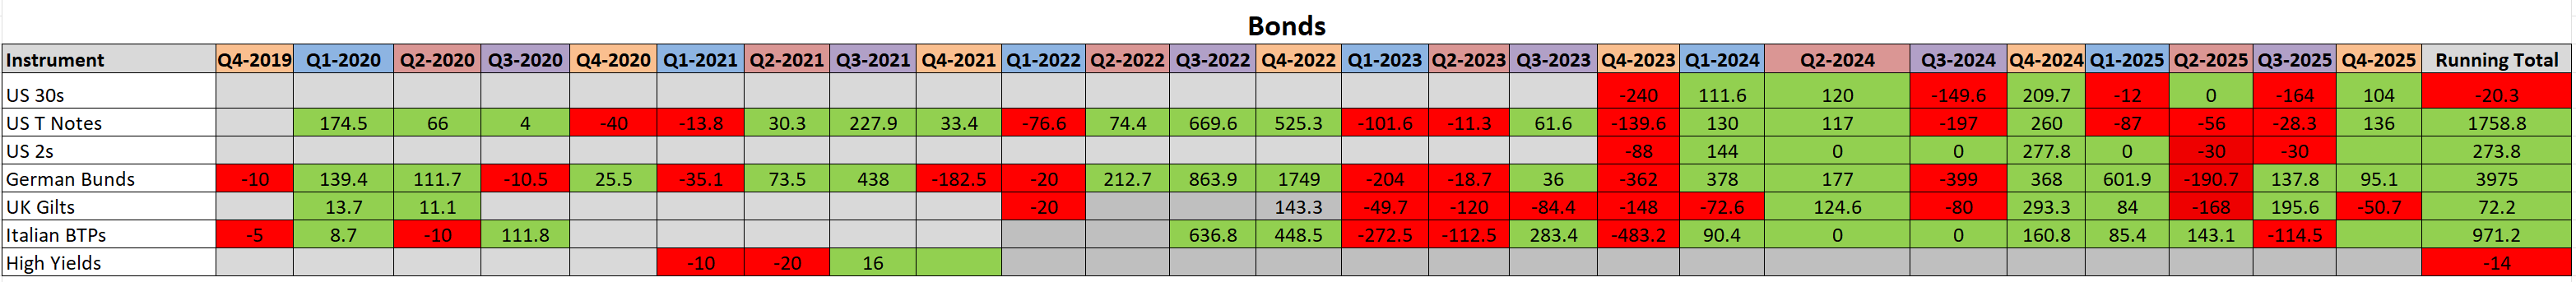
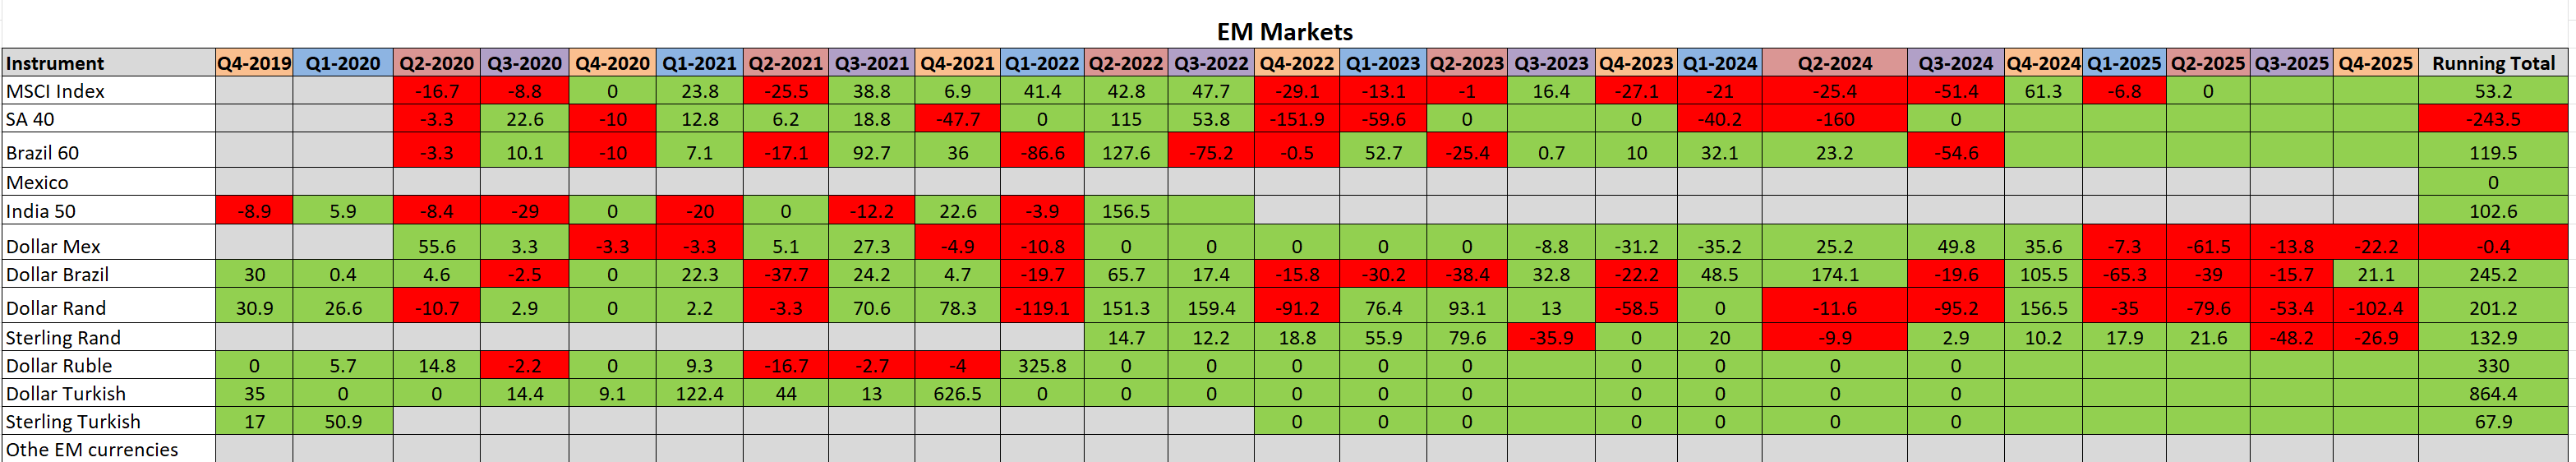
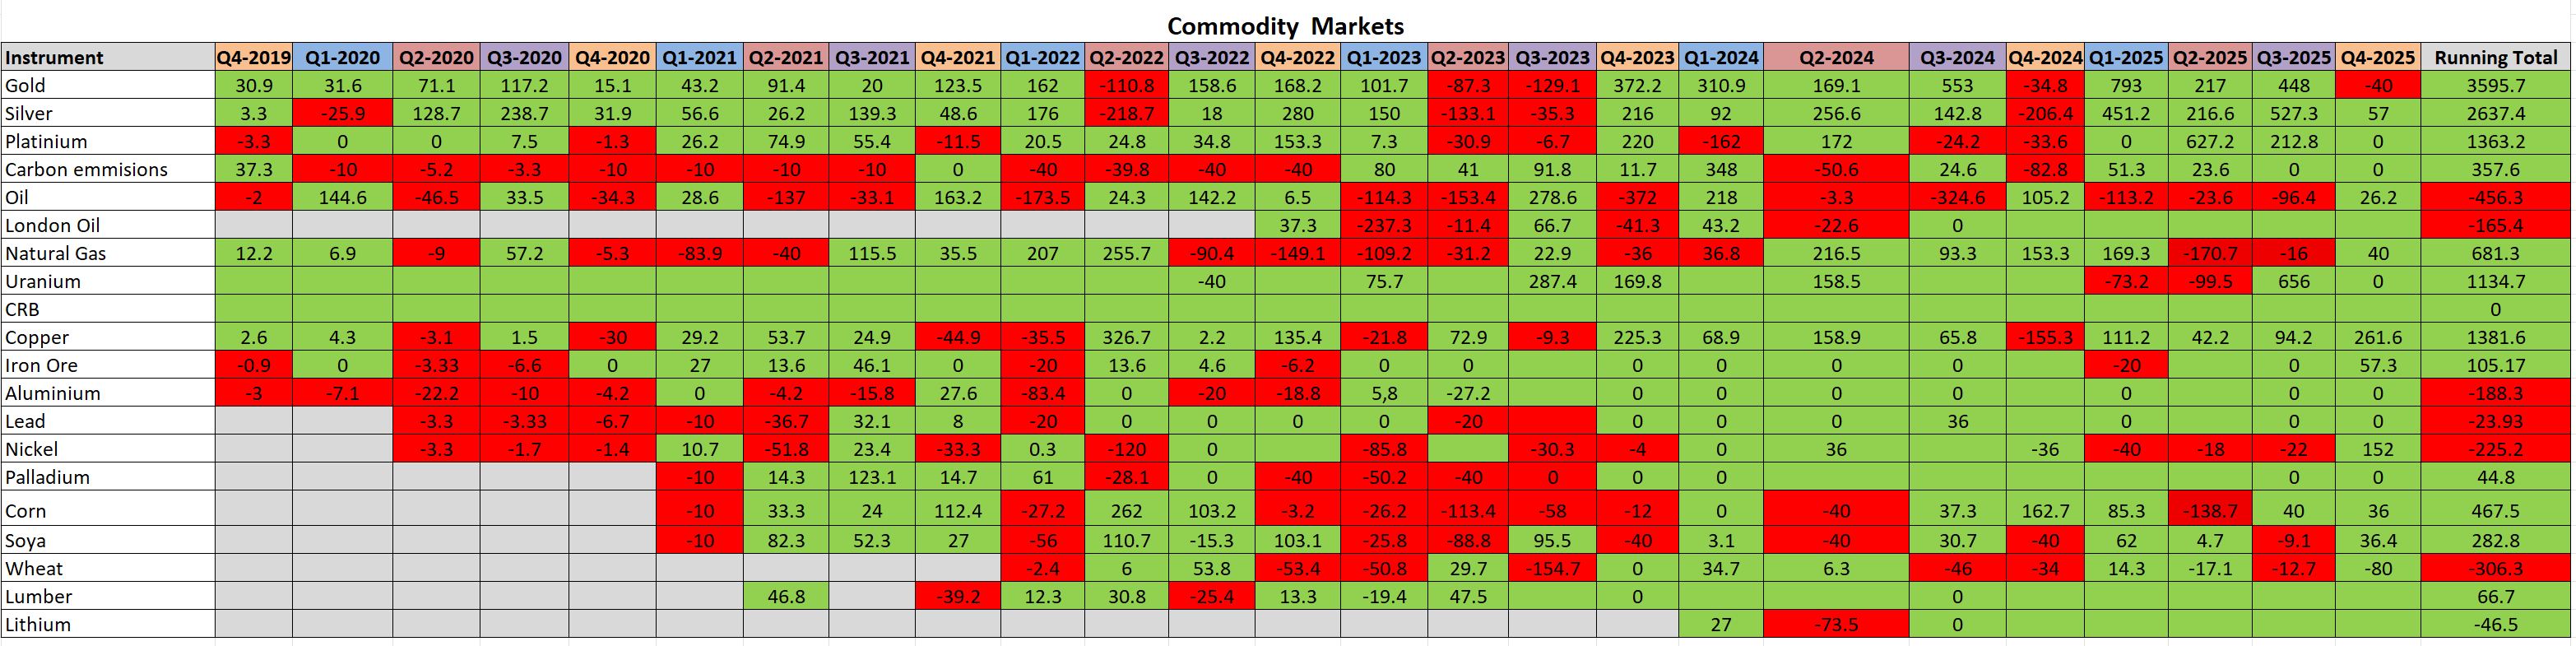
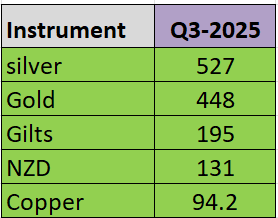
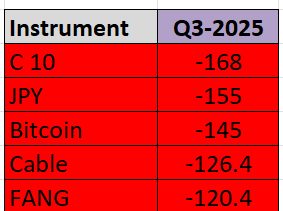
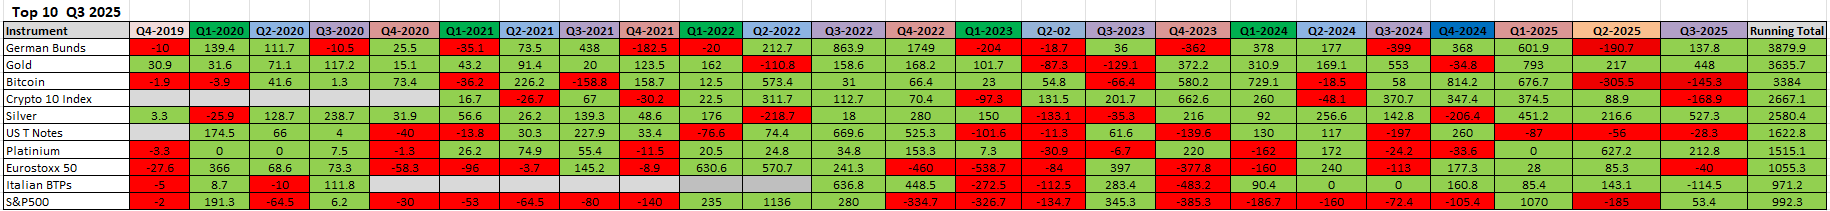
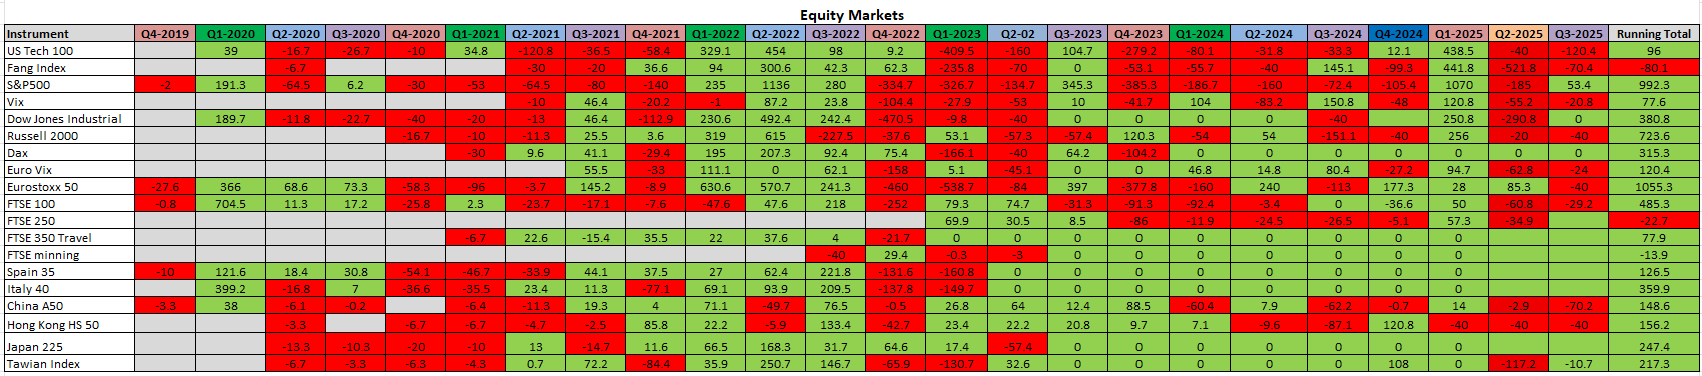
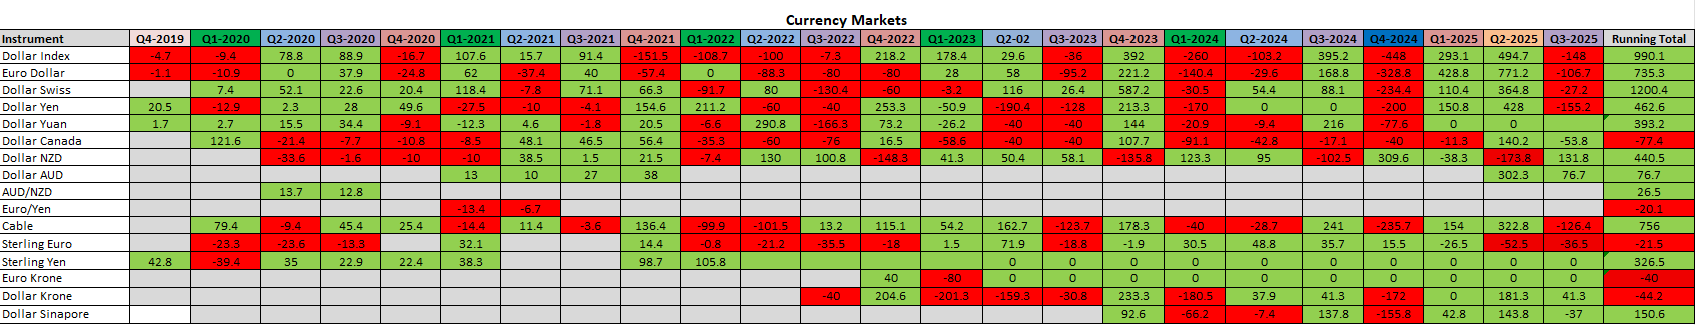
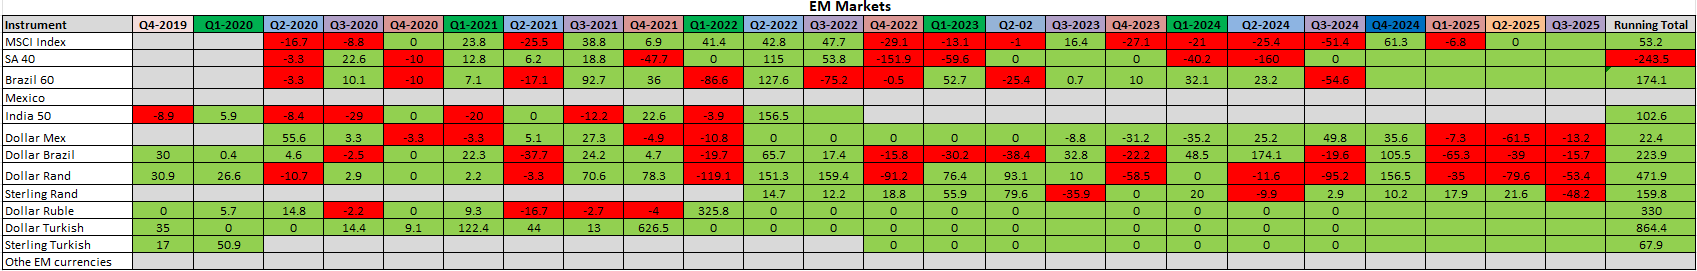
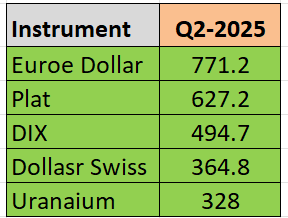
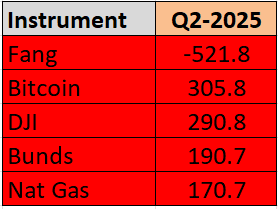
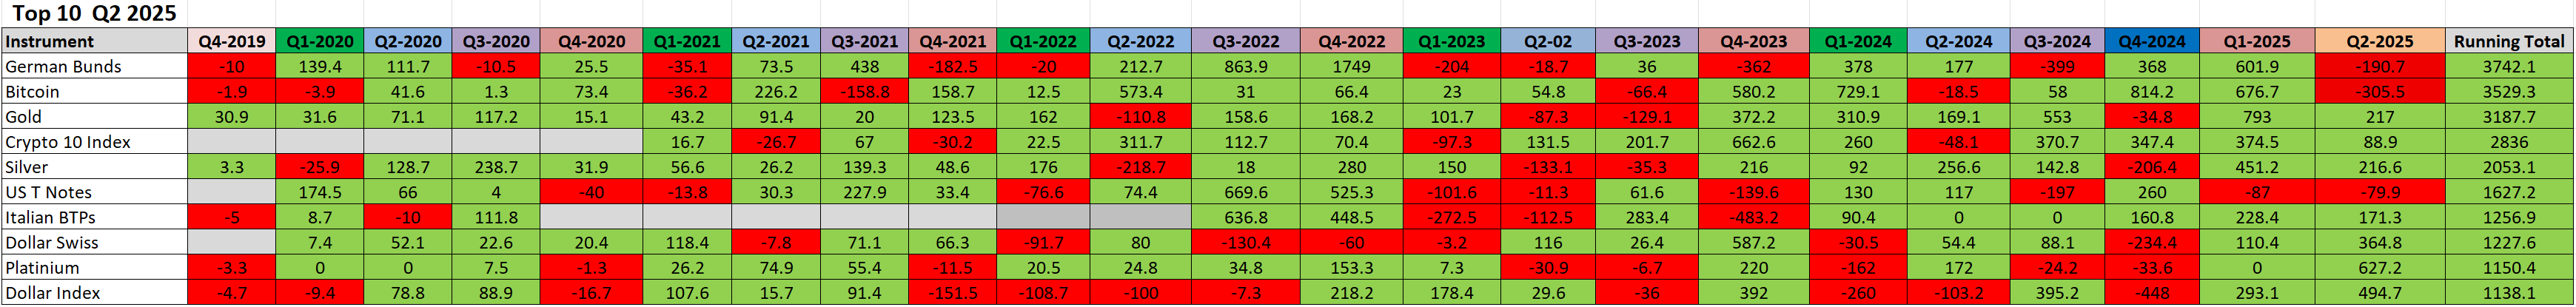
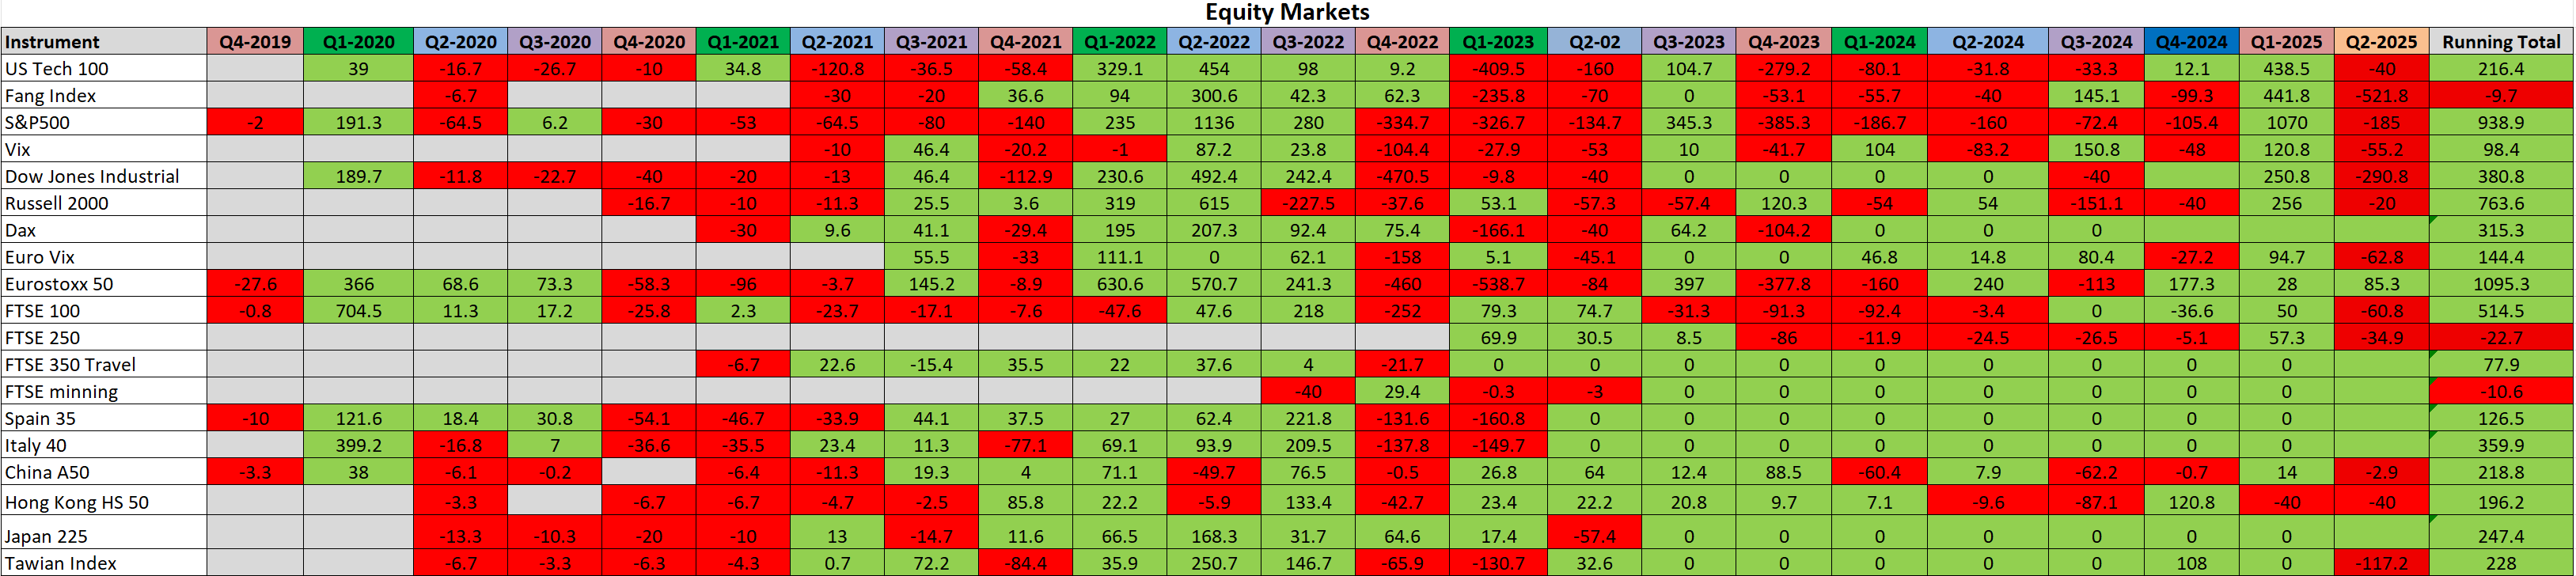
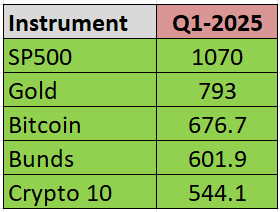
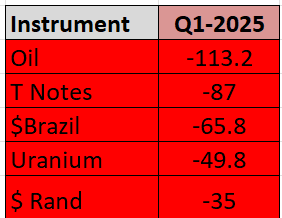
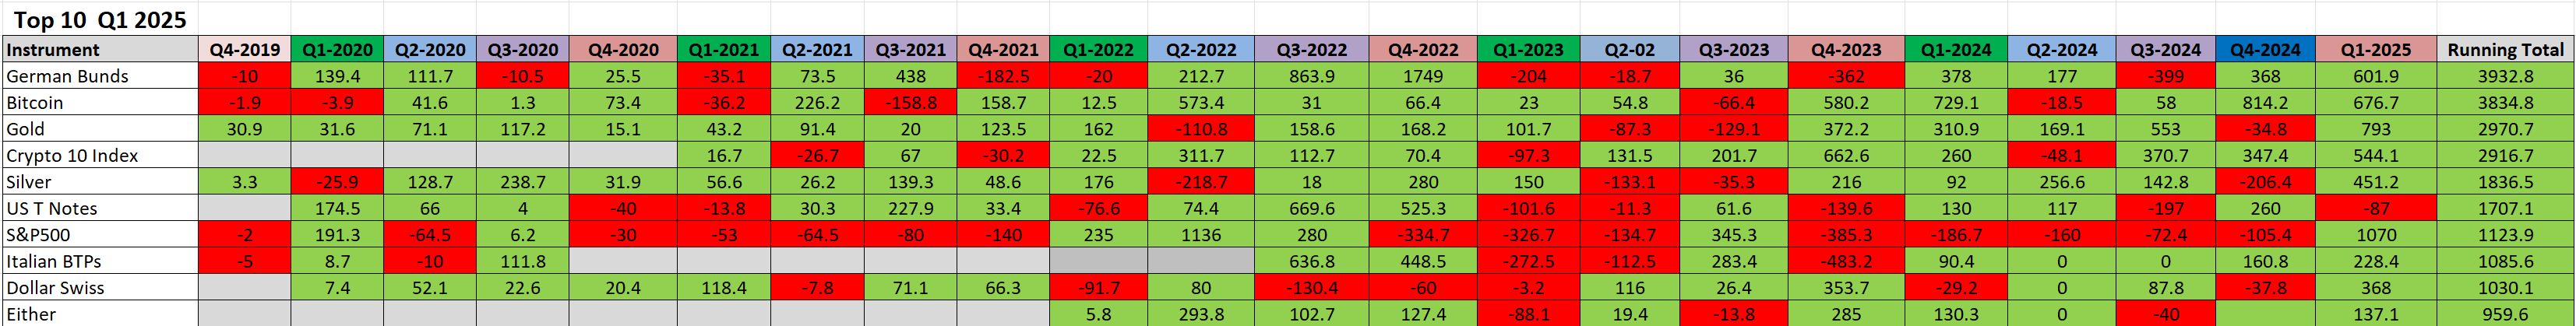
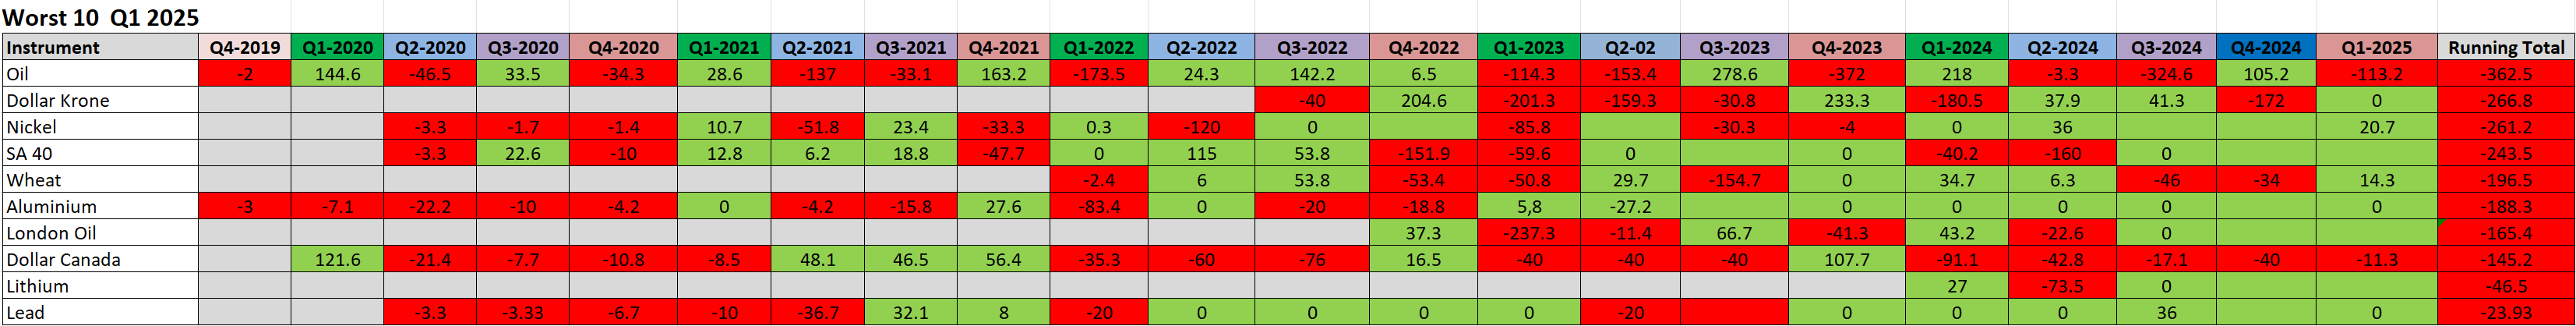
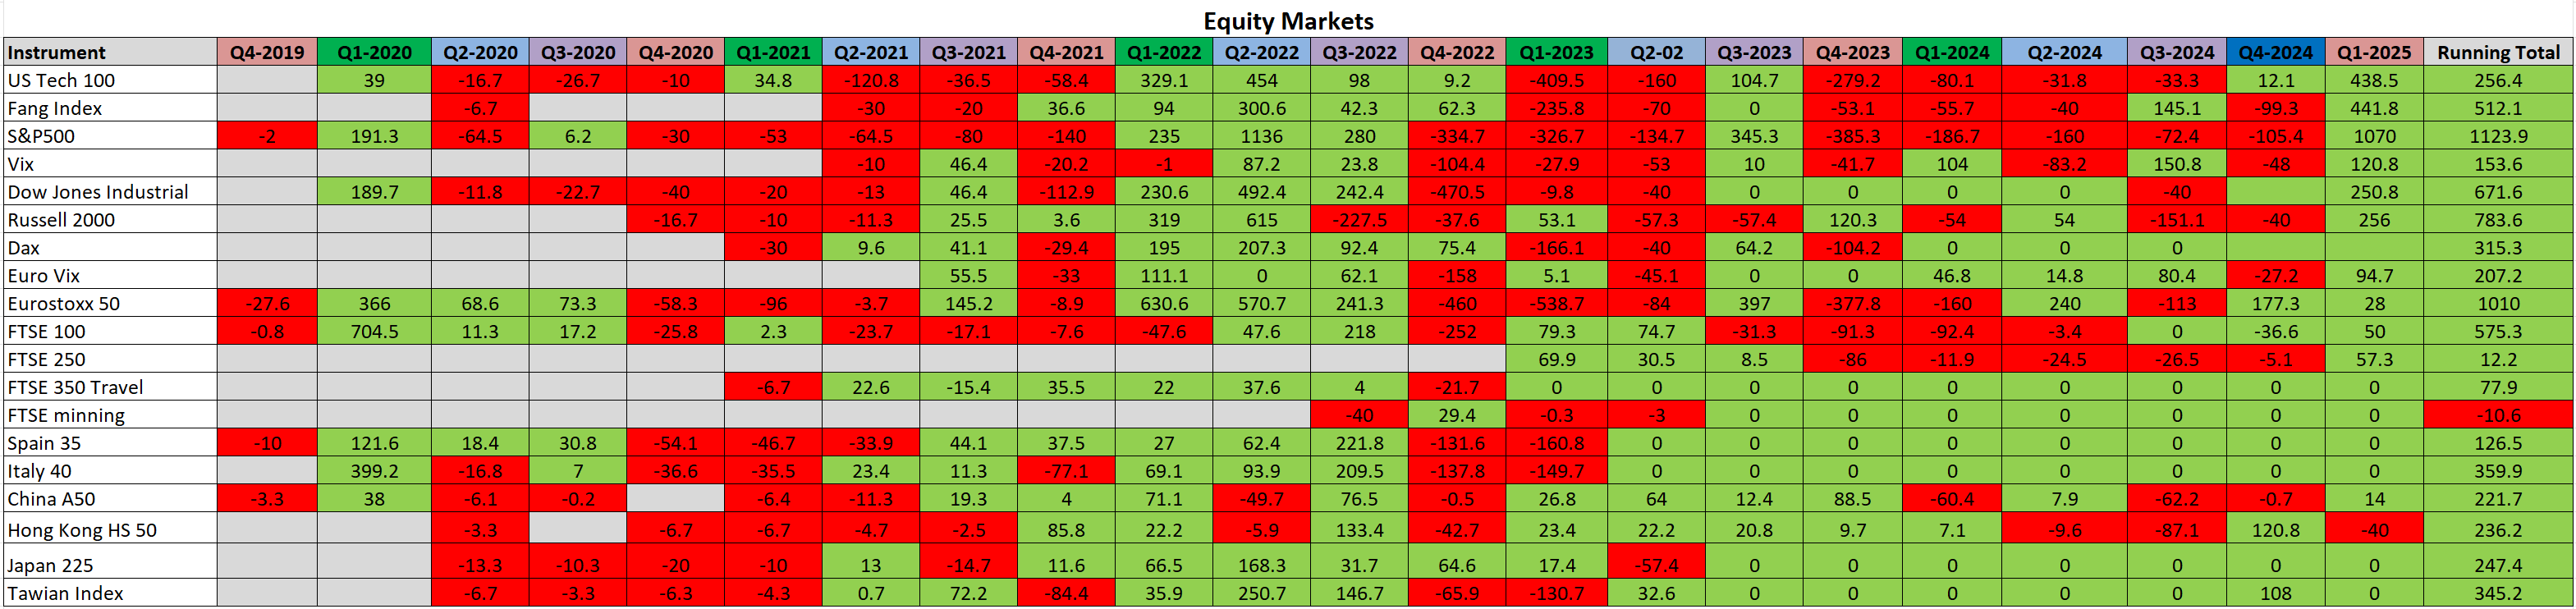
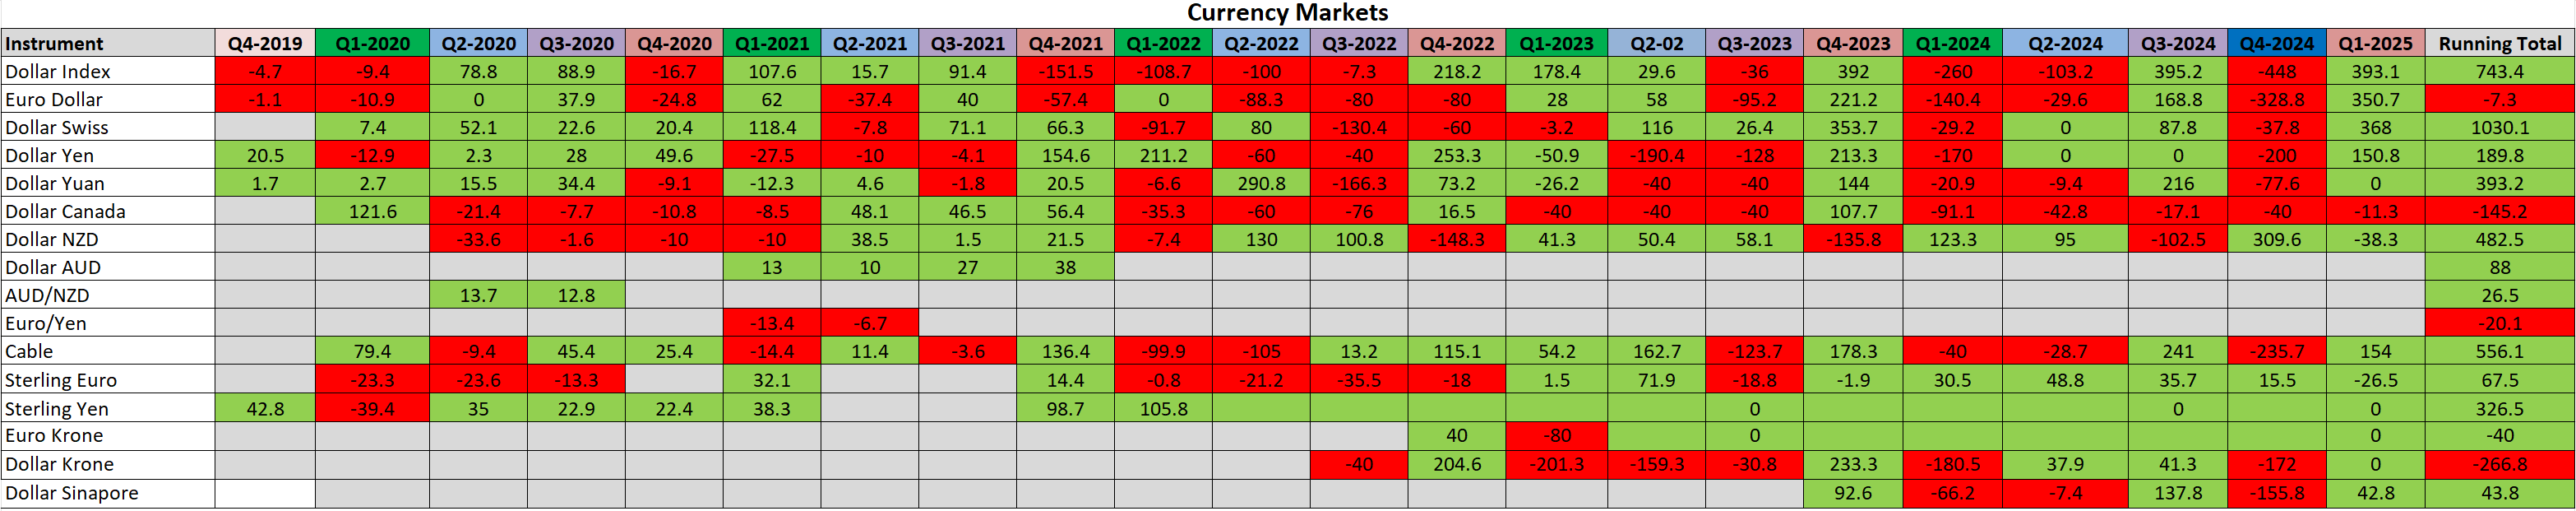
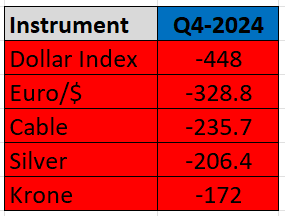
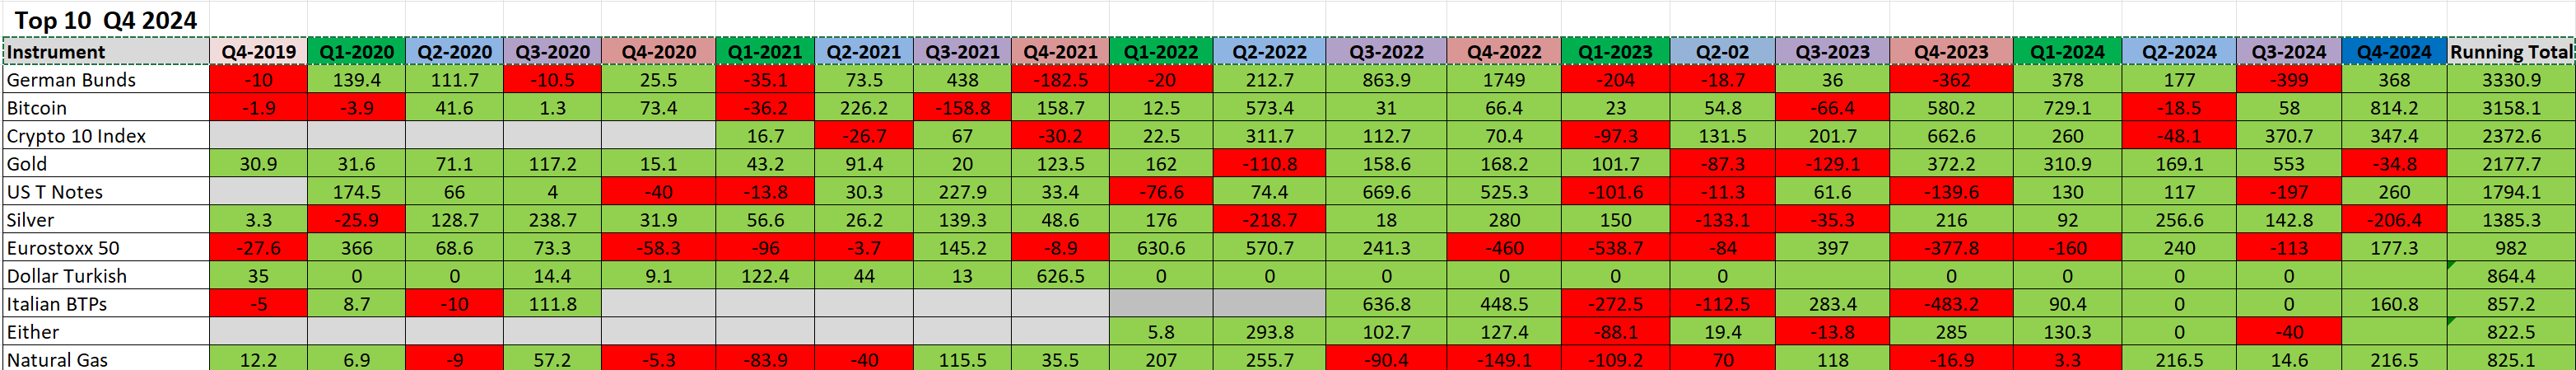
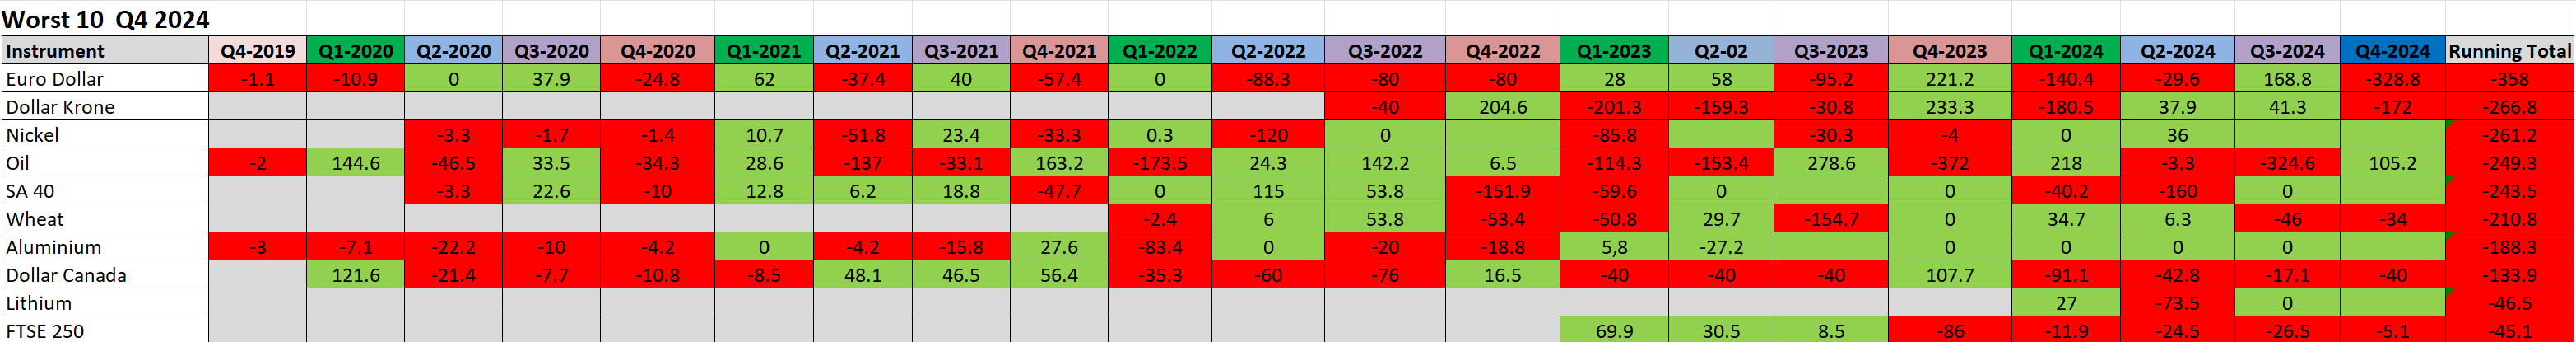
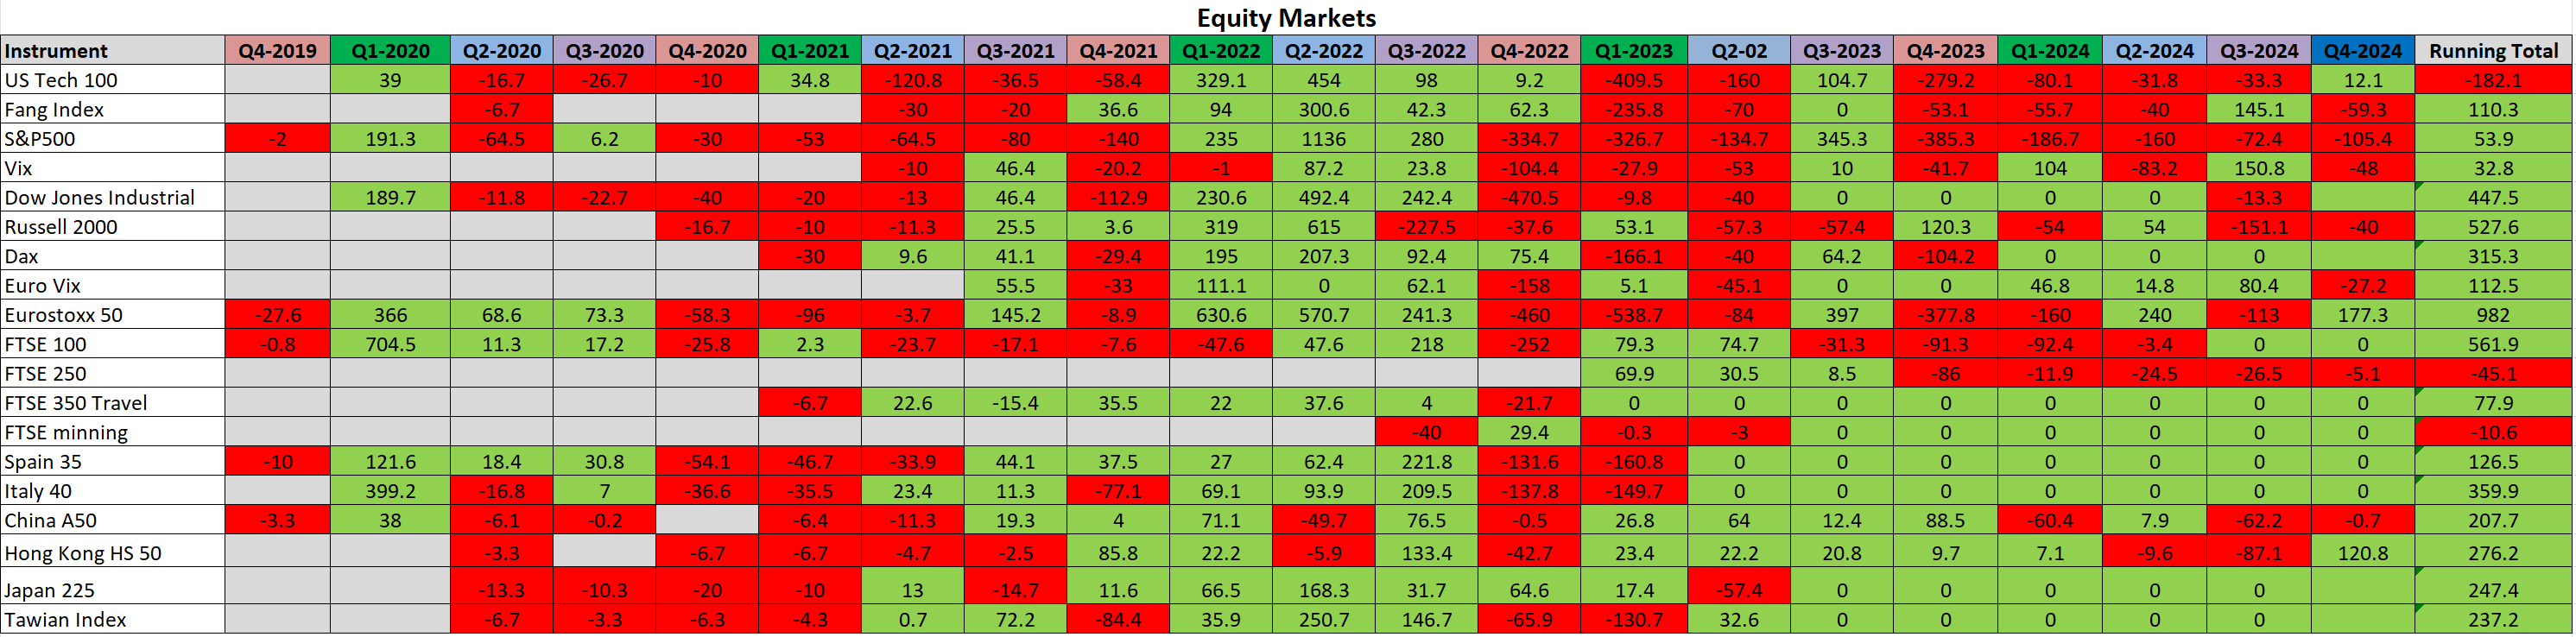
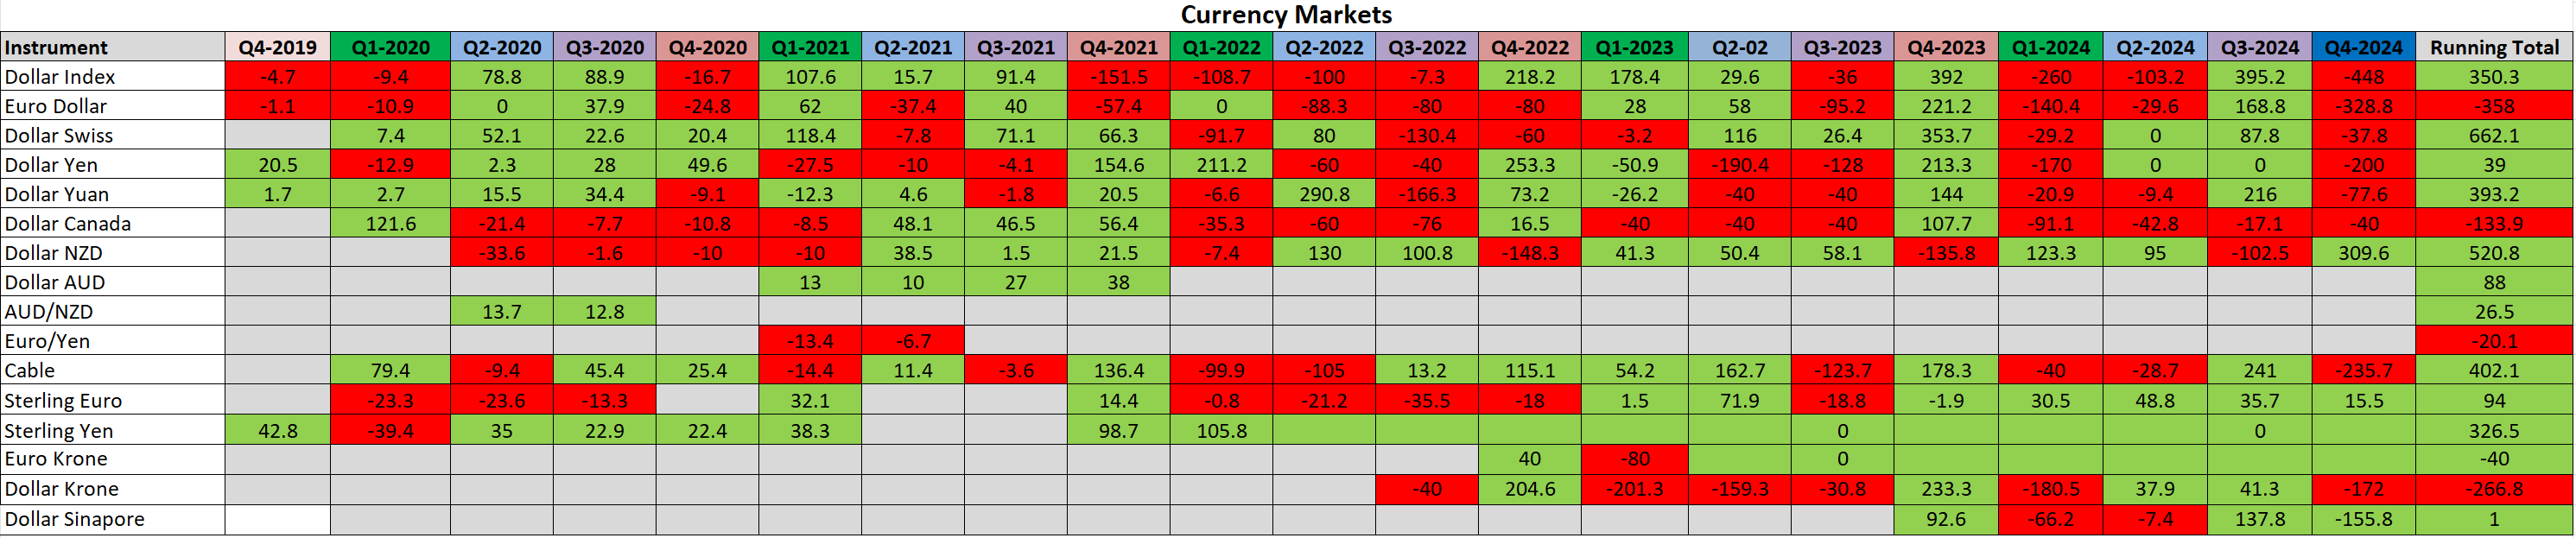
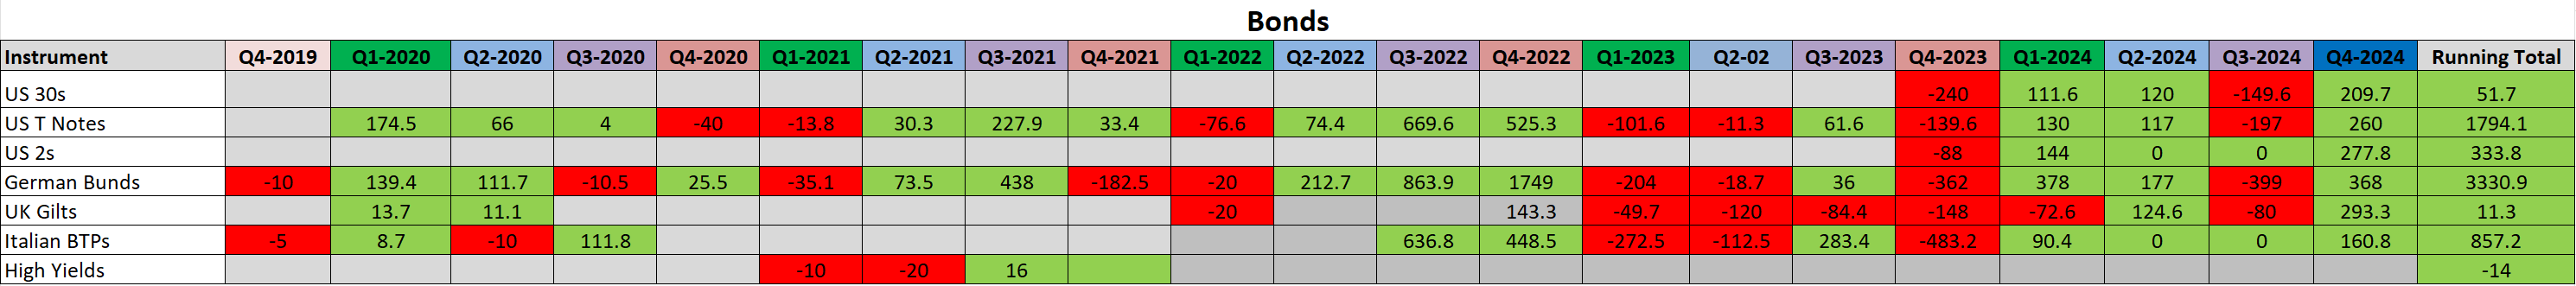
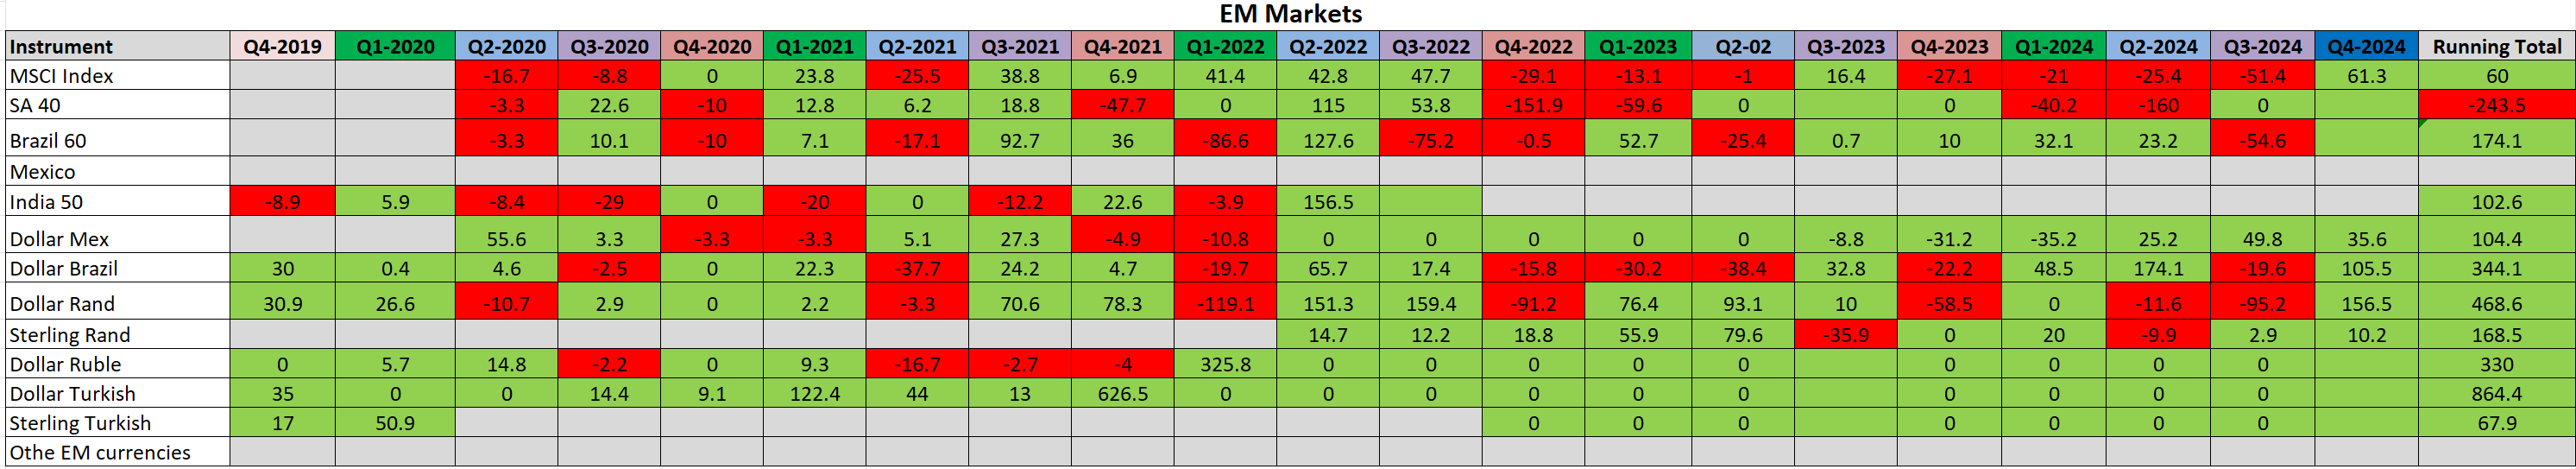
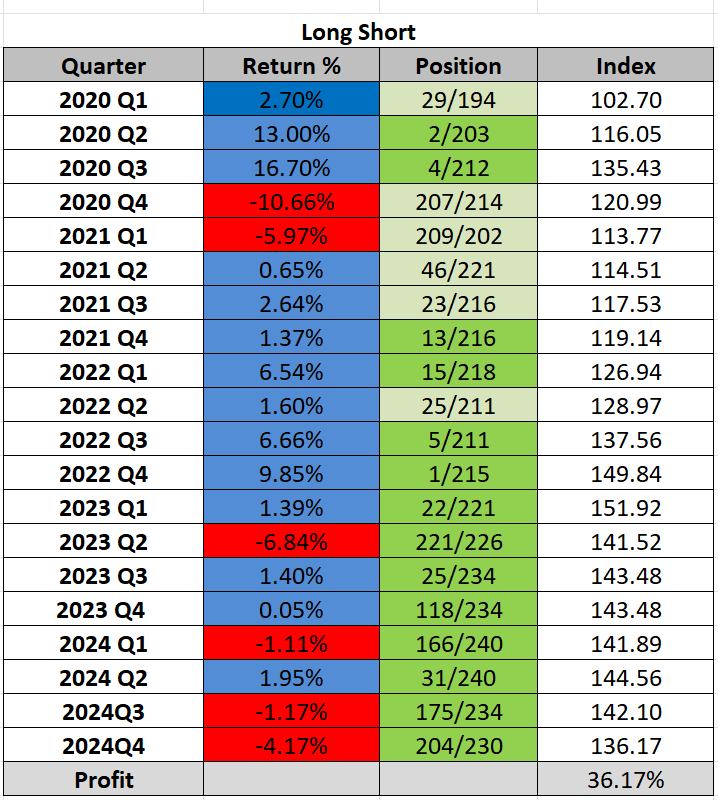
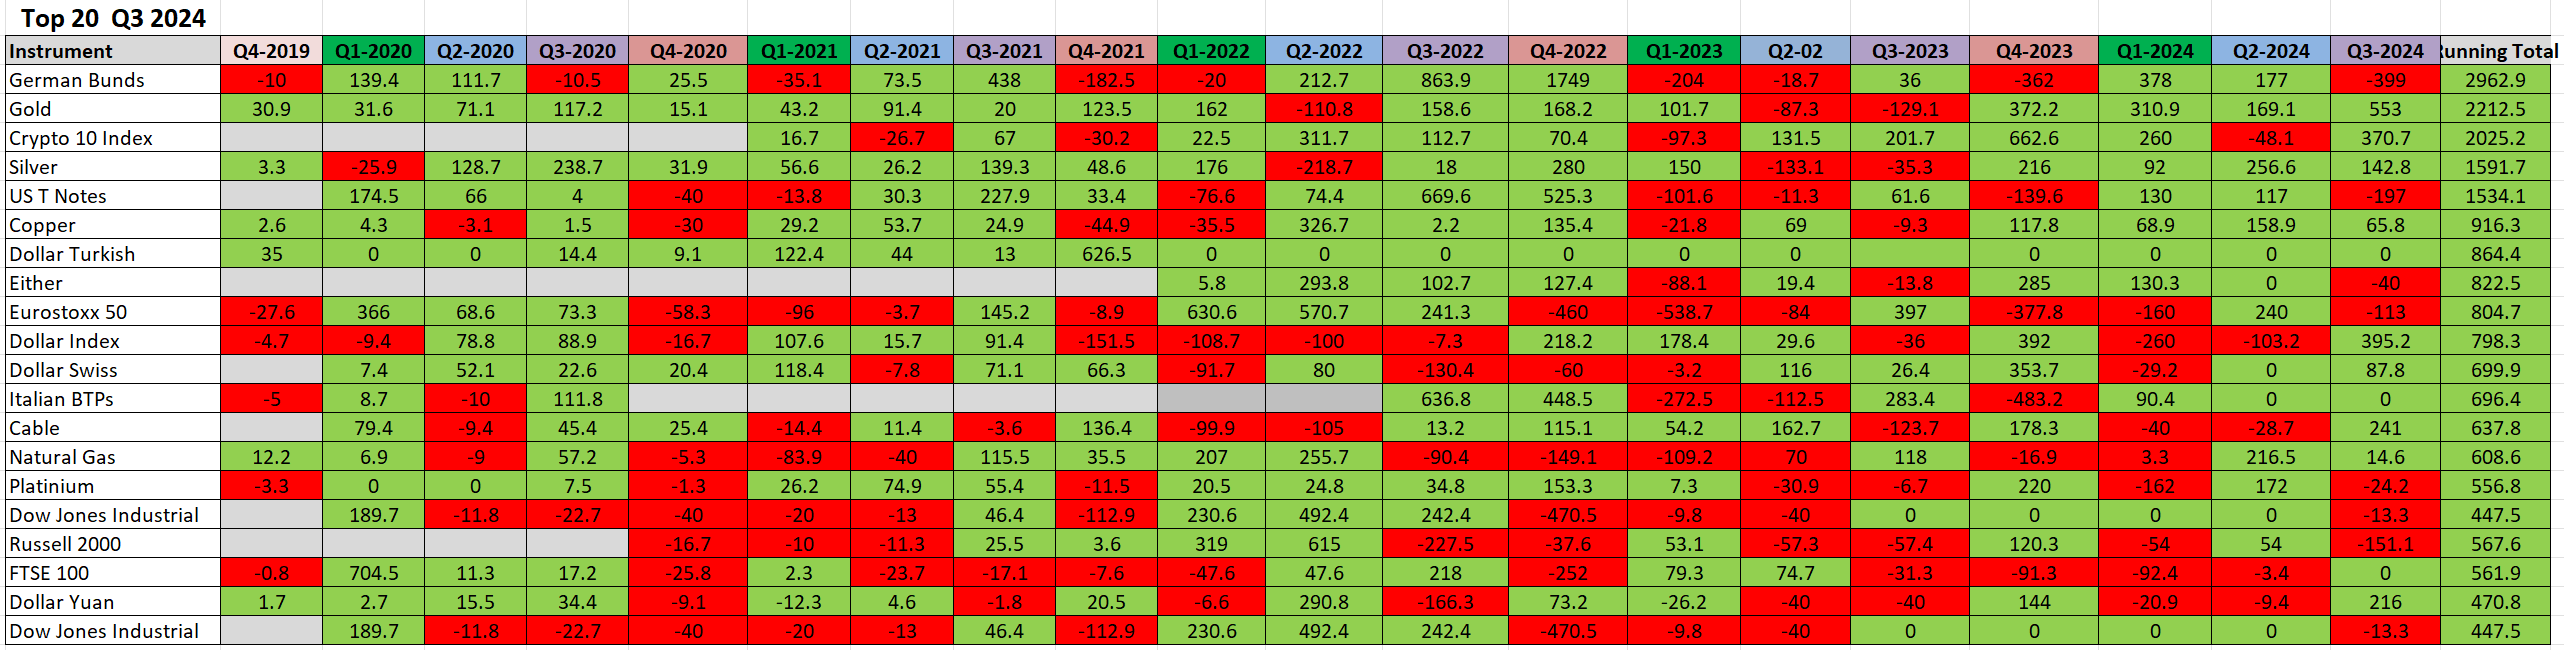
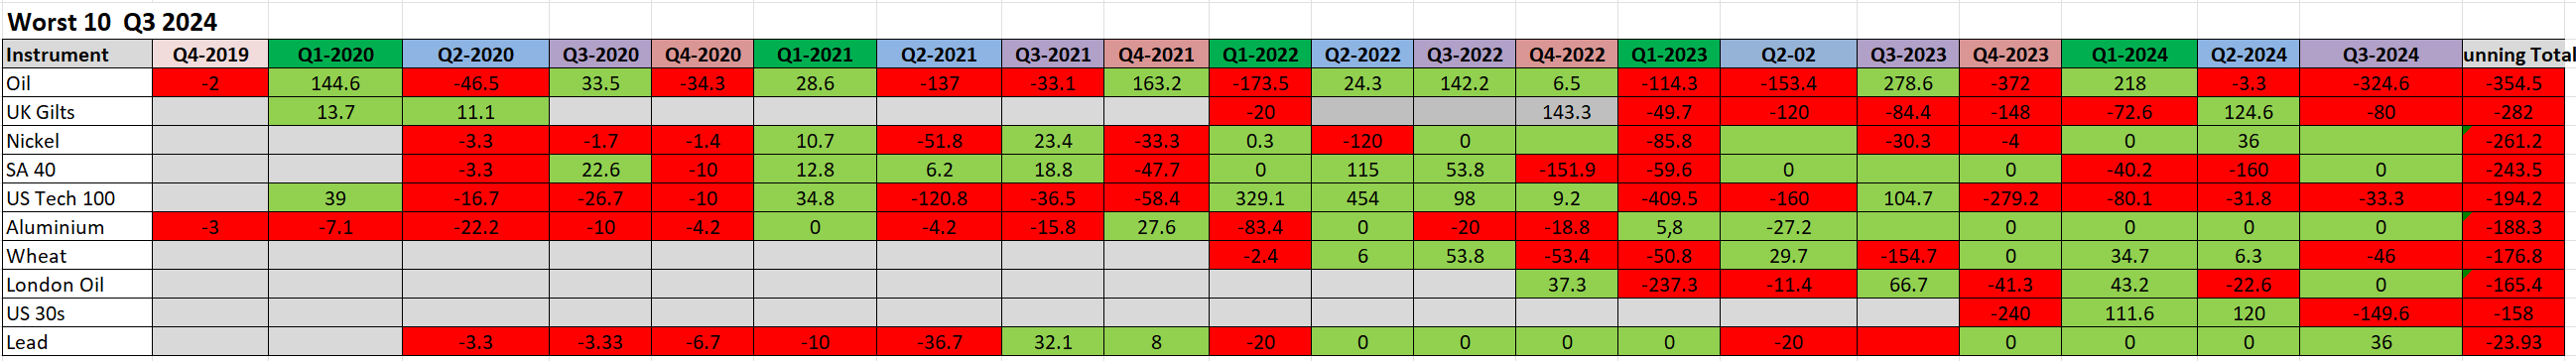
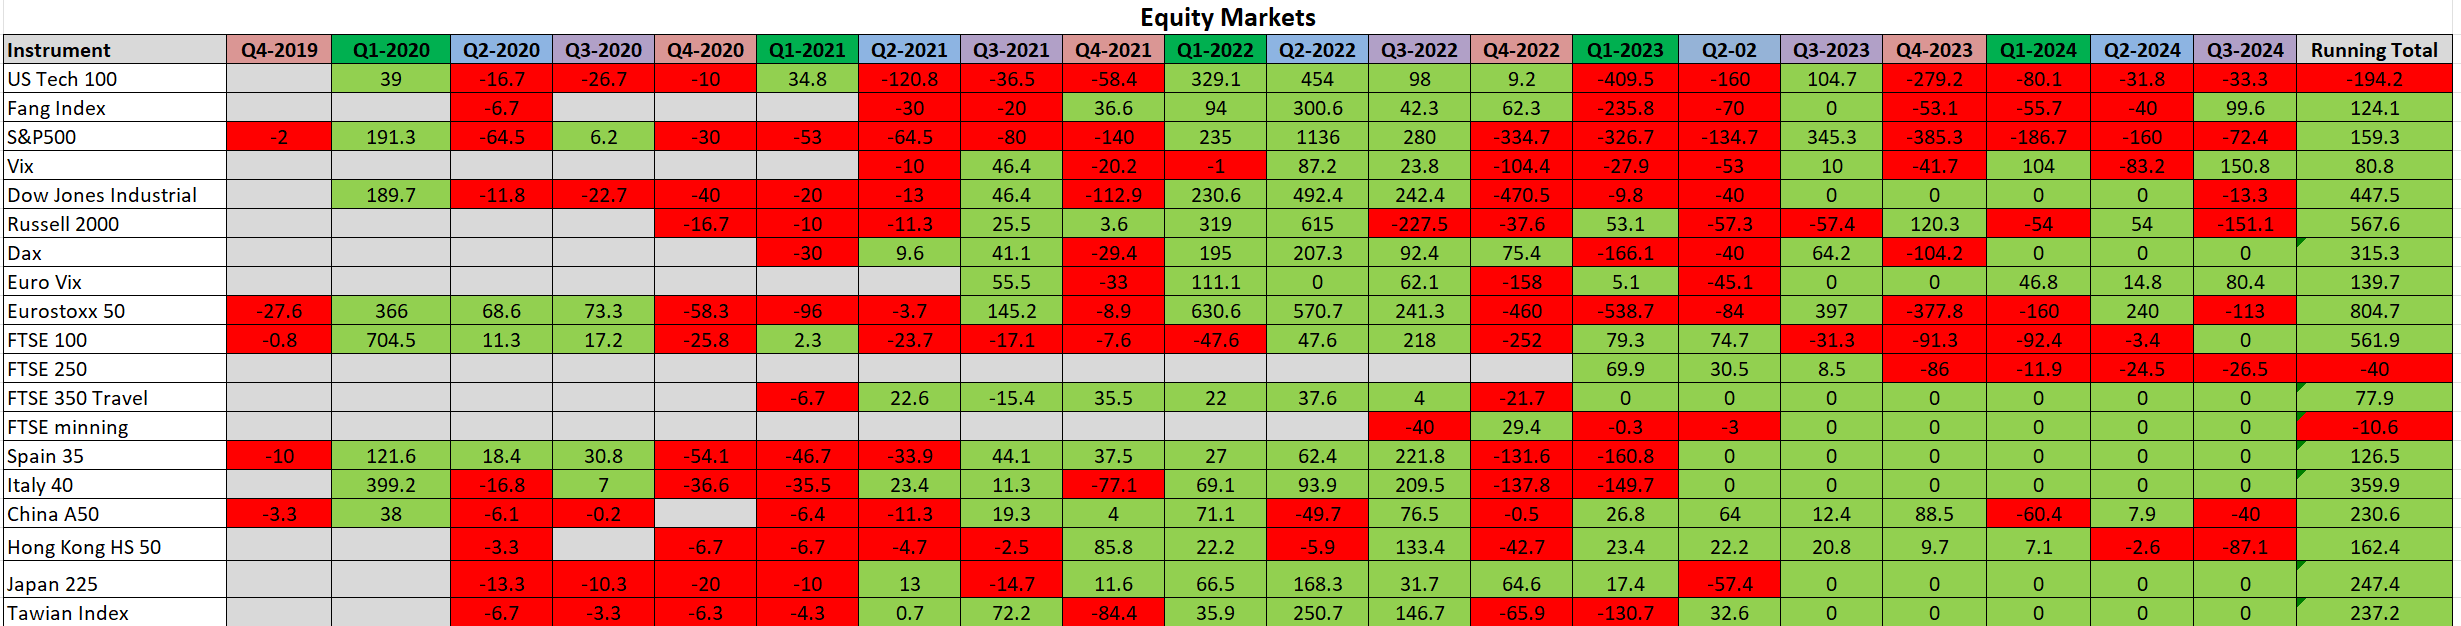
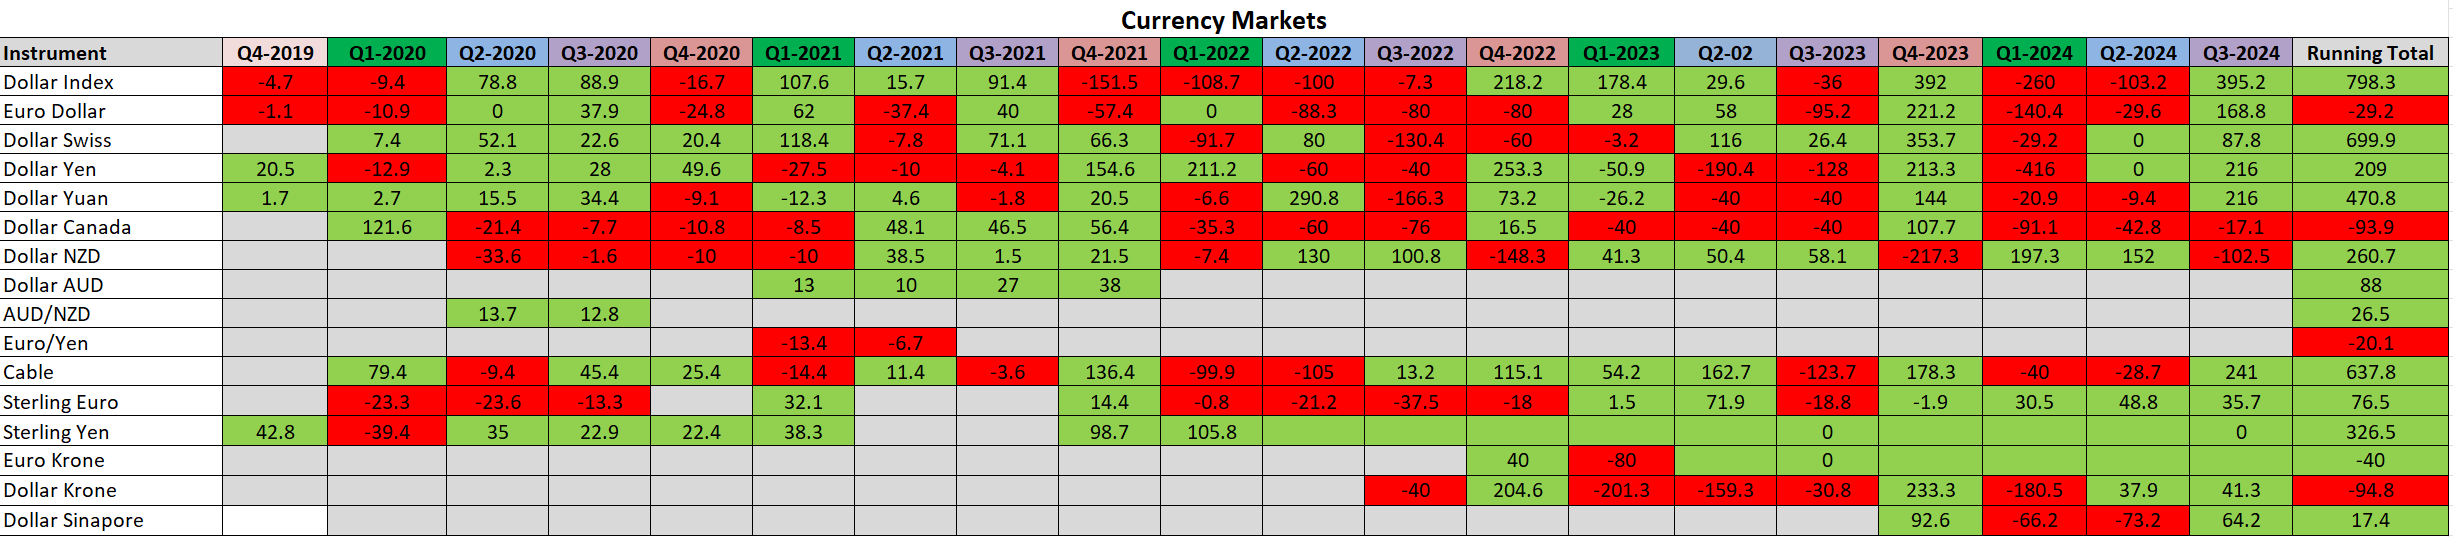
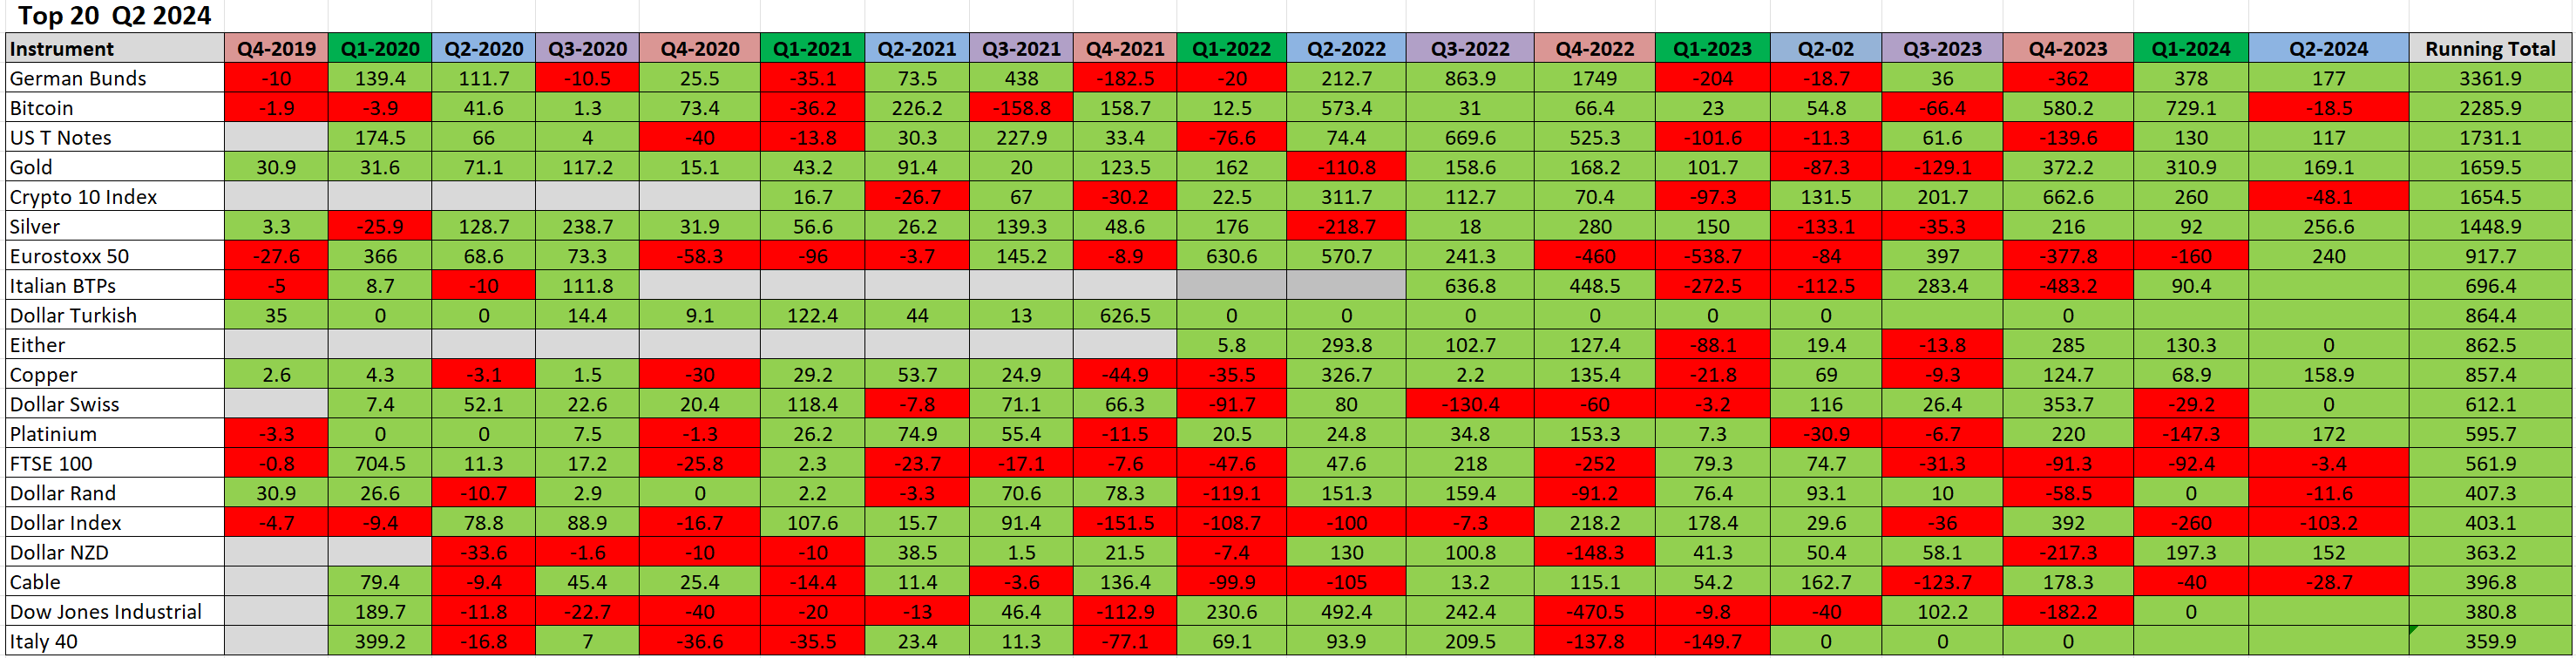
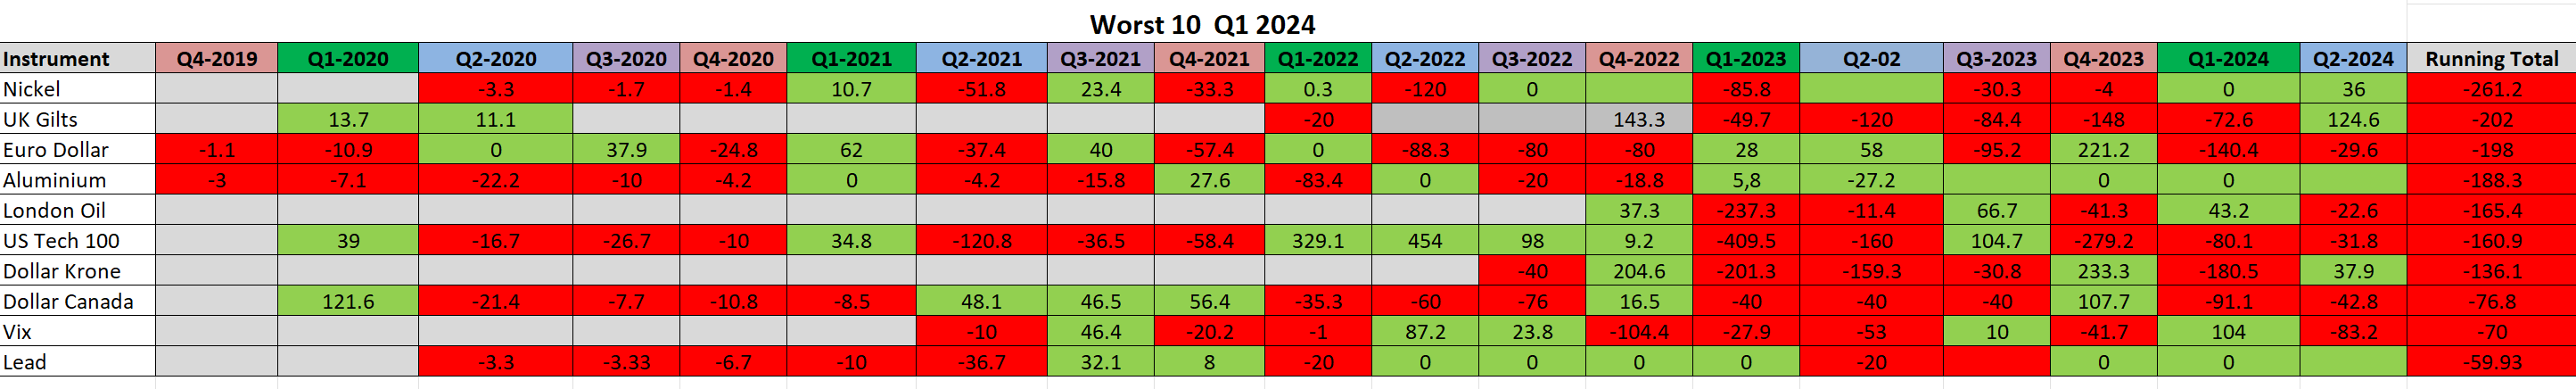
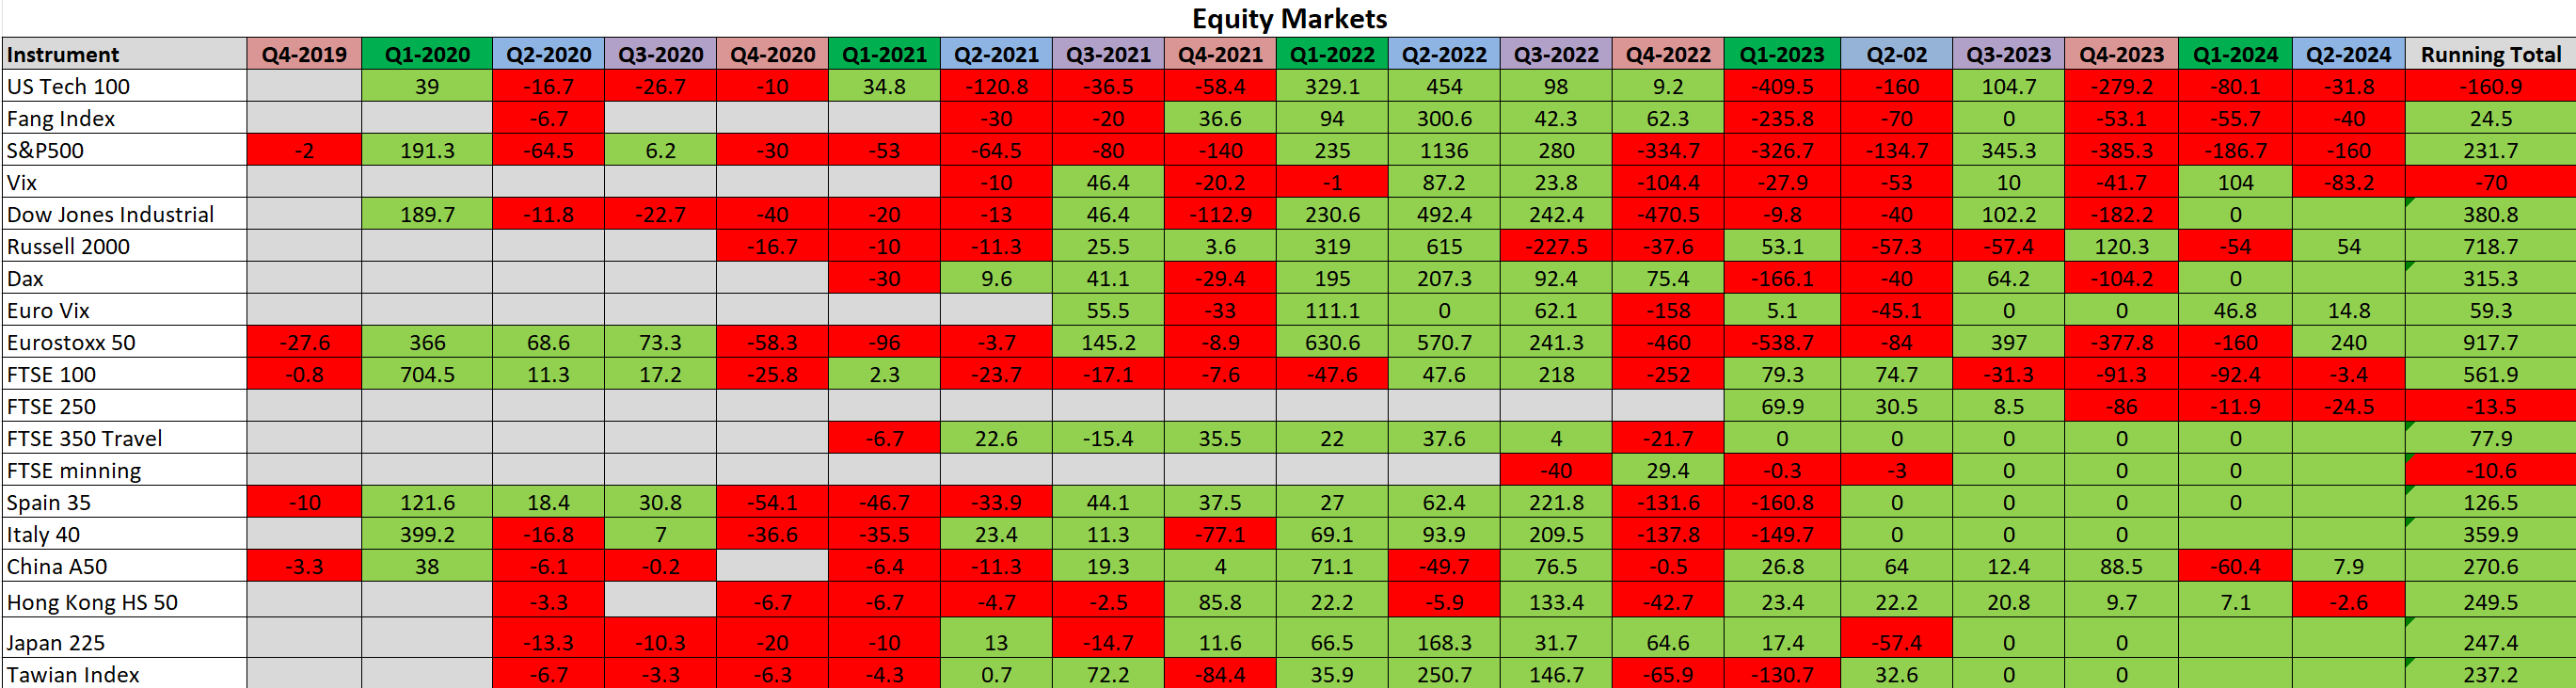
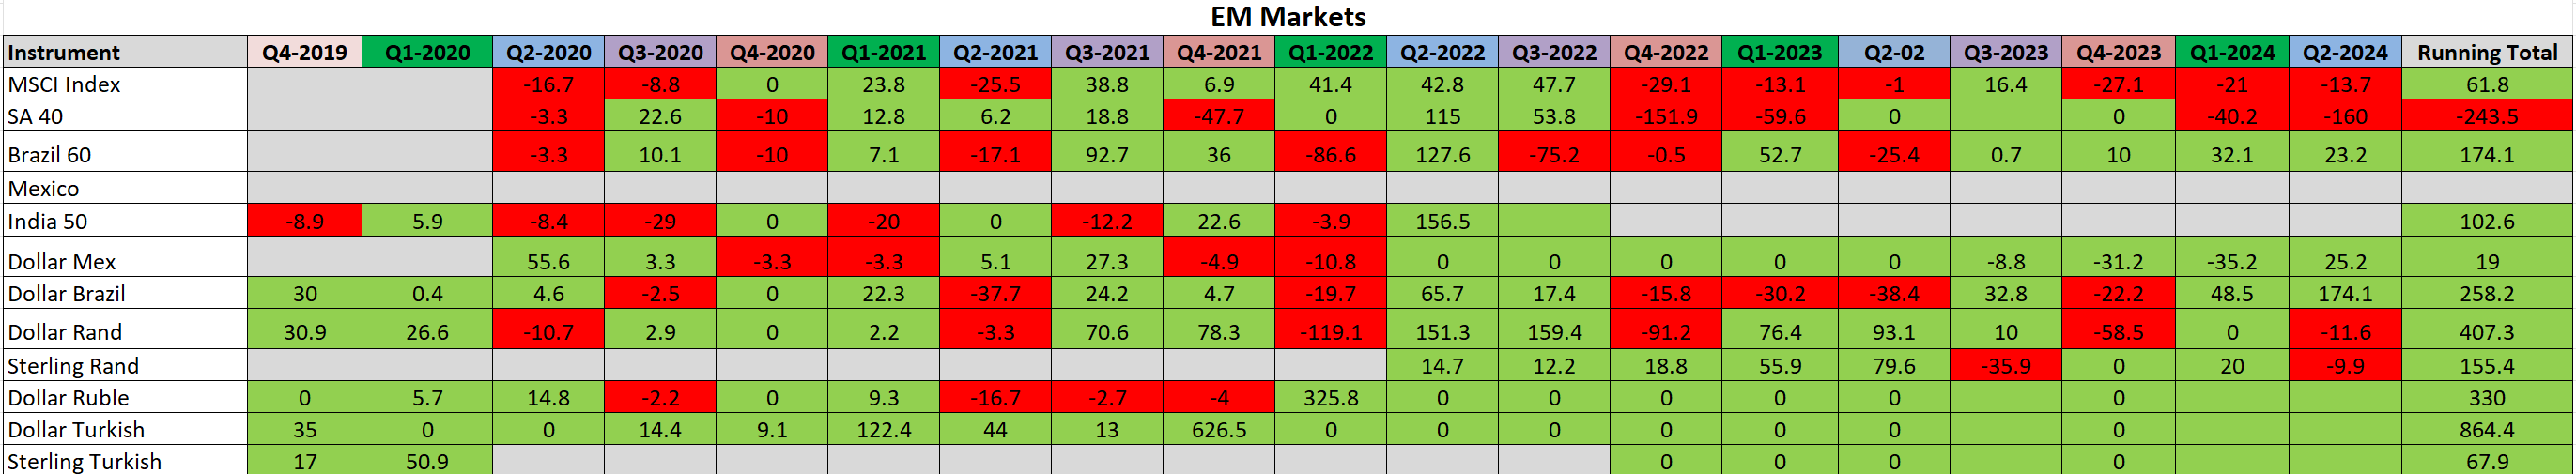
Every quarter we then publish our results for every sector and every market and a summary of our top 15 best markets at the end of each quarter. Showing our consistency and breadth of coverage.
Image
Portfolio Construction
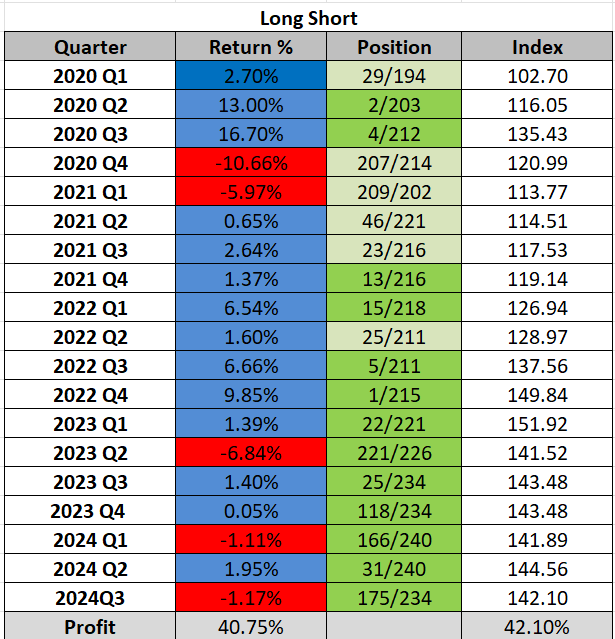
From this system, we can build any portfolio according to the market and sector and the risk allowance.
Eg a simple silver plus gold portfolio that equated to risking 0.5% per 10 trade units would have made
Gold(720 units) plus silver (985.1 units)=42.2% over 9 quarters
never risking more than 1% at any one time, except the last current trade that risked 2%
These are significant risk-adjusted returns.
Furthermore, we can build any portfolio of any composition using this process in our long-short share positions.
Long/Short Sectors
This service is designed to provide long term and medium term investment outlooks in a range of markets including:
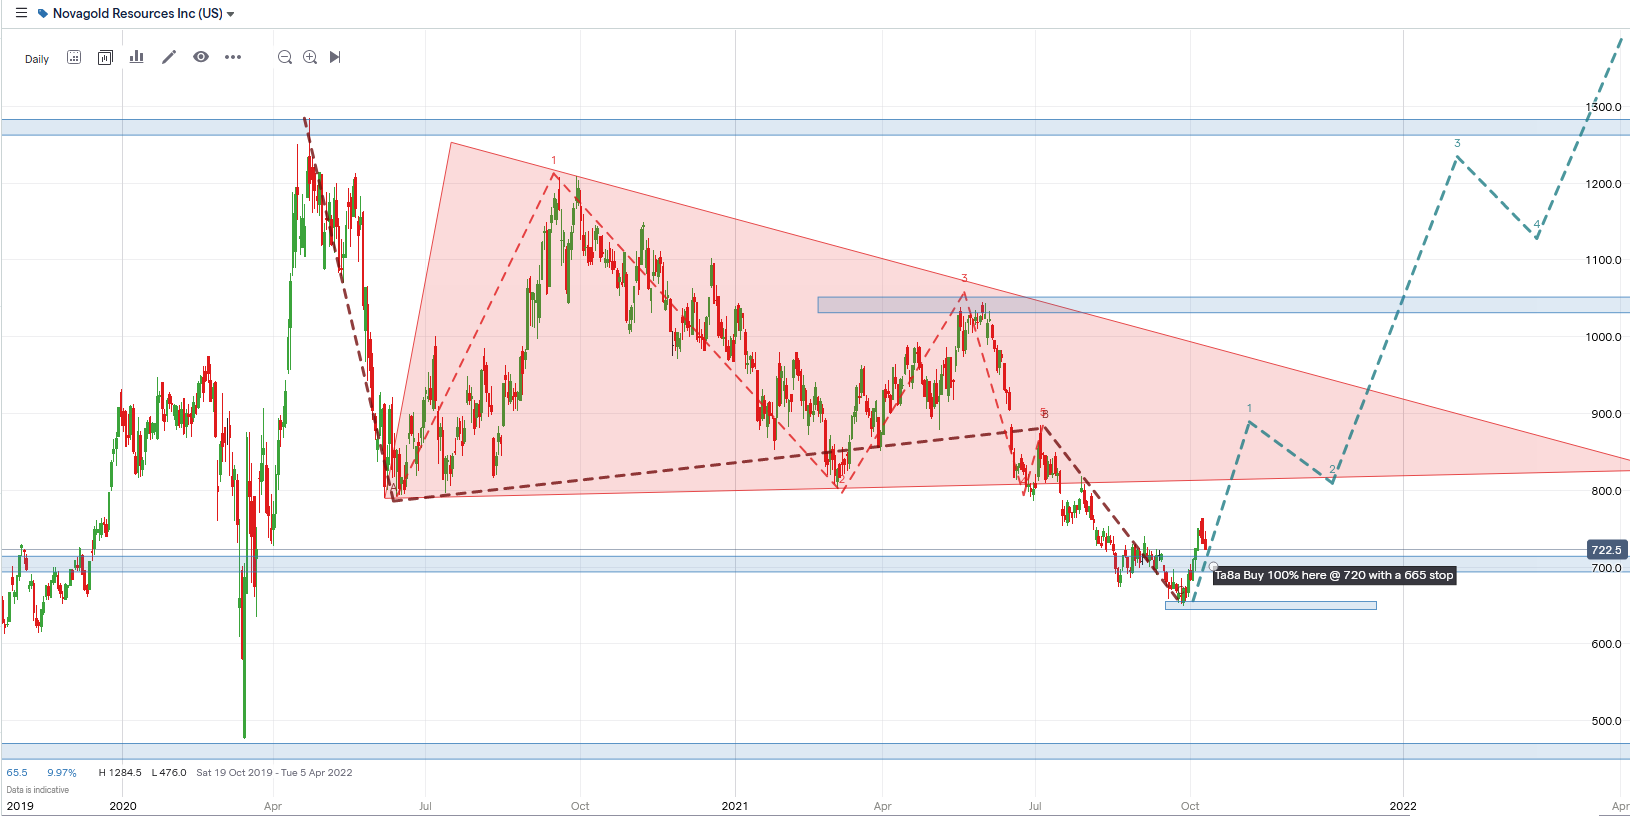
Gold Miners
- Eldorado Gold
- Wheaton Precious Metals
- Harmony
- Agnico Eagle Mines
- Kirkland Lake Gold Ltd
- Novagold Resources
- Barrick Gold
- GoldFields
- Hecla Gold
Funds
- Blackrock
- Berkshire Hathaway
- Lansdown
Silver Miners
- Pan American Silver
- Silver Lake Resources
- SSR Mining
- Coeur
- Sibyane Stillwater
Platinum Miners
- Anglo American Platinum
Heavy Industry
- Fuji Heavy Industries
- Melrose
- US Steel
Homebuilders
- DR Horton
- Barratt
- Lennar Corp
- Pultegroup Inc
Mining
- Glencore
- BHP
- Freeport McMoRan
- Rio Tinto
- Yellow Cake PLC
Hi-Tech
- Taiwan Semi Conductor
- Apple
- Meta
- Microsoft
- Tesla
- Amazon
Russell 2000 Shares
- Appian
- Gamestock
- Gamestock
- Novavax
- Plug Power
Aviation
- Airbus
- International Consolidated Airlines Group
- Boeing
- Rolls Royce
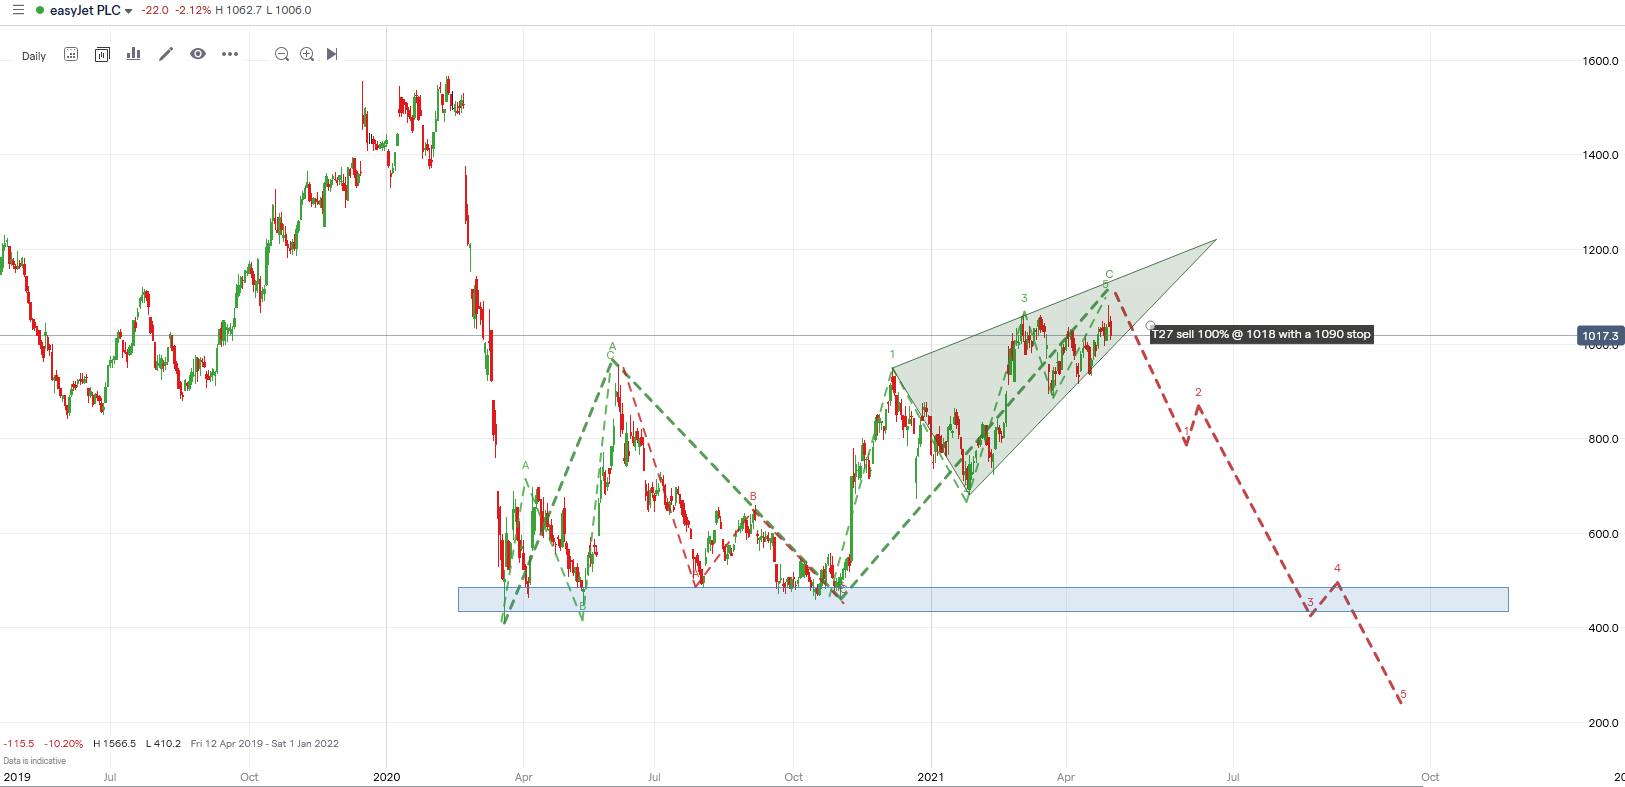
- Easy Jet
Space
- Virgin
Banks
- HSBC
- Lloyds PLC
- Nat West PLC
- Capital One
- Bancorp
- Bank Of America
- Bank Of Asia
- Bank Of Scotland
- Barclays
- Citi
- Goldmans
- JPM
- Lloyds
Credit
- Mastercard
- Visa
Energy
- BP
- Chevron
- Exxon
- Premier Oil
- Shell
- Tullow
Entertainment
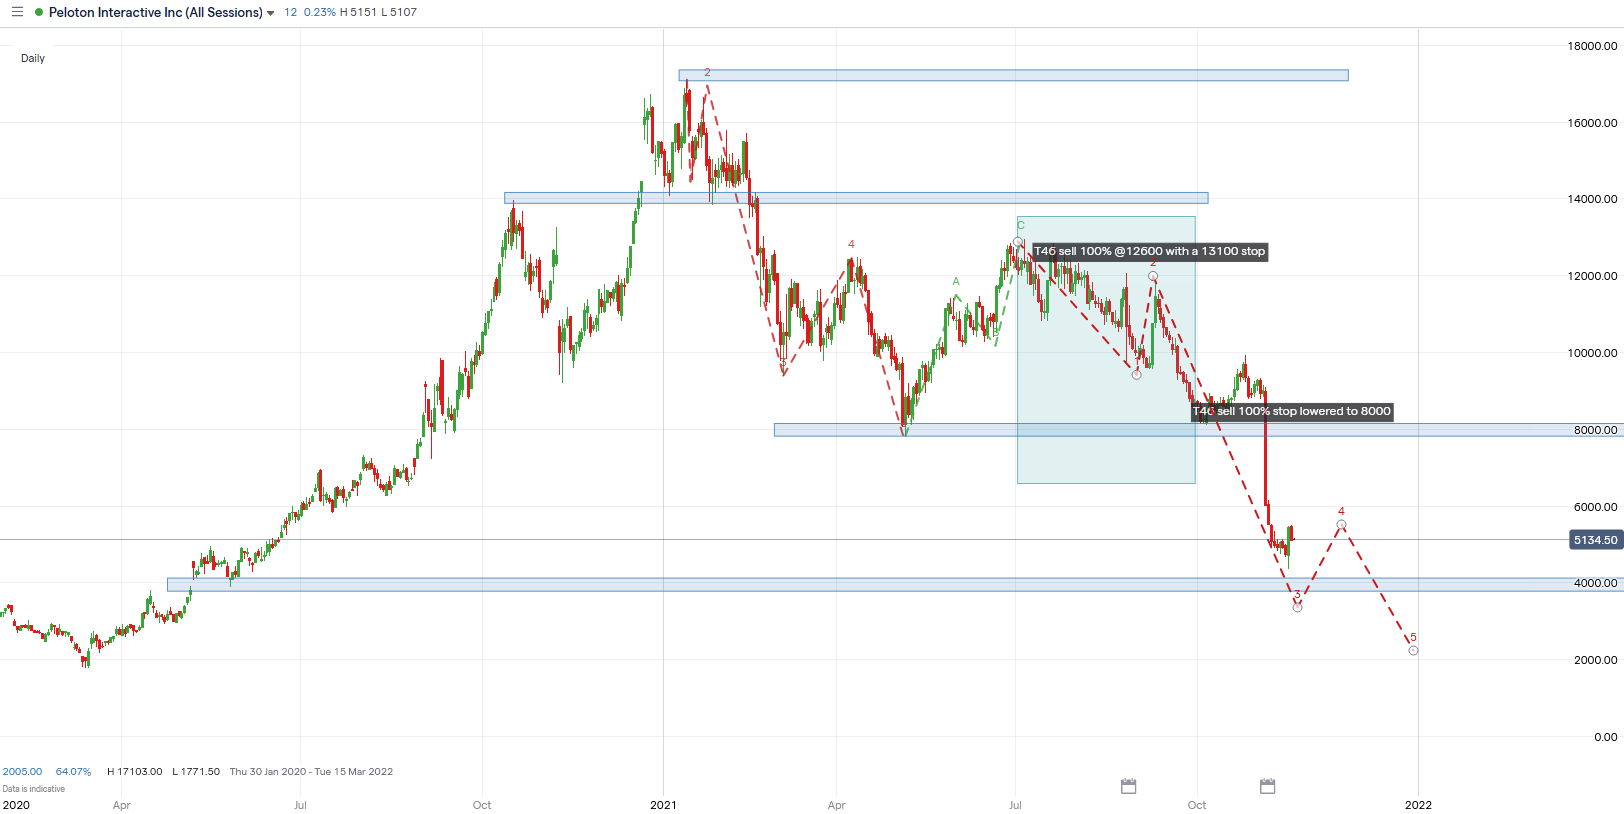
- Peleton
- Netflix
- Disney
Those marked in bold are more frequently updated.
Sample Executions
Below are some examples from the sectors covered. Click on a sector or use the arrows provided to view each slide.
1. Who Are Our Clients?
Global Forecaster’s clients range from the largest pension funds and hedge funds in the world to family offices, professional investors (as defined by the FCA). All who value our long and medium-term strategies. Whilst our hedge fund clients benefit from our specific trading recommendations as part of an integrated strategy. All benefit from the increase of 360-degree situational awareness that we offer, derived from a source of analysis that is independent of the impact of collective sentiment that makes most analysis bullish at the highs and bearish at the lows.
- Banks
- Pension Funds
- Resource and commodity companies
- Hedge Funds (Macro and Long/short)
- Corporate Treasuries
- Family Offices
- HNWIs
2. How To Access Our Market Analysis and Predictions
Global Forecaster has created a range of Products for the needs of both Macro Directional and Long Short Clients; All new updates will arrive by email to your inbox within 5 minutes of publication. We offer paid trials of 3 months and thereafter 12-month rolling subscriptions. All prices are ex-VAT.
1. The CIO's Macro View Subscription
Comprises our full spectrum market strategy across all seven Macro sectors defined below, which integrates all of the elements of our Geopolitical perspectives (Murrinations Insights) and market views into one coherent strategy and perspective. They are updated as and when major market events provide new information, which is on average once or twice a month. This product is ideal for CIOs and Senior Risk takers to gain an external and independent perspective. Our clients include hedge funds, pension funds and family offices. Our strategies cover long and medium time frames, and are designed to be used in conjunction with our Macro Trade Executions to maximise risk versus reward through short-term entry points that then cascade in the longer-term trend direction. This comprehensive product delivers our full-spectrum market strategy across all seven macro sectors outlined below. It seamlessly integrates our geopolitical insights (via Murrinations Insights) and market perspectives into a single, coherent strategic framework. Updates are issued in response to major market developments, typically one to two times per month.
Designed for CIOs and senior risk-takers, this service provides an independent, external perspective to support high-level decision-making. Our clients include hedge funds, pension funds, and family offices. The strategy spans both medium- and long-term time horizons and is best utilised alongside our Macro Trade Executions, enabling clients to capitalise on short-term entry points that align with broader long trend dynamics—thereby optimising risk-reward performance. £1800 per month + VAT (UK only) Engage David
2. Macro Trade Executions are linked to Premium and Global Macro Subscriptions.
We provide real-time entry points, stop levels, and recommended position sizes for trades aligned with the strategies outlined in our CIO’s Macro View. Our alpha-generative performance results are published quarterly, enabling clients to evaluate the accuracy of our forecasts and the quality of our returns across different sectors. New trade recommendations are delivered via email, offering timely, actionable insights. Each market sector is available for individual subscription or as part of our comprehensive Global Macro Package. The global market sectors include:
- Equity Indices
- FX
- Cryptocurrencies
- Bond Markets
- Emerging Market FX and Indices
- Commodity Markets
3. The Premium CIOs View Subscription
(The Premium CIOs View includes one sector for Additional sectors can be purchased at the same time at a cost of £1200 per month + VAT (UK only).
This includes one sector of Macro Trade Executions (from the above list), Murrinations Insights and The CIOs Macro View £2600 per month + VAT (UK only). Engage David
4. The Global Macro Package Subscription
Includes Murrinations Insights, The CIO's Macro View, and The Premium CIO's View, along with access to all of our Macro Trade Execution sectors — all included in a single, comprehensive package. £6000 per month + VAT (UK only). Engage David
5. The External CIO Advisory
Offers a bespoke service that at its lowest level provides twice-monthly discussions on markets and geopolitics, and at its highest level seamlessly integrates every element of the Global Macro Package subscription with the risk management and return objectives of each client’s portfolio. This is delivered through personalised discussions and direct engagement, including tailored support on trading psychology to help optimise performance. Whether navigating drawdowns or maintaining discipline during a strong run, this service enhances decision-making under pressure and maximises returns. Starting at £10,000 per month + VAT (UK only). Engage David
6. The Arkent Fund – The Arkent Fund is Global Forecaster’s unleveraged long fund that supports high-net-worth individuals in managing their assets with our real-time portfolio management, with changes sent out in real-time. The rationale behind the fund comes from CIOs View, which is included in the package. This is not research but rather an inside-out asset management process, which is designed to cost 1% on a minimum of assets of £3 million per year. £2500 per month + VAT (UK only) Engage David
7. Murrin One-To-One - Geopolitical & Market Insights — When You Need Them – Global Forecaster is pleased to offer a new one-on-one premium service for Asset managers and C suites. Gain exclusive, timely, tailored geopolitical and market analysis with a consultation with David to address your strategic needs and specific questions. Engage David
- Expert insights on geopolitical shifts and market moves.
- Customised discussion focused on your priorities.
- Flexible scheduling—book at a time that suits you.
- £6000 per hour + VAT (UK only)
Book your session today.
Global Forecaster's registered office is:
The Mill, Blackdown Park, Haslemere, Surrey GU27 3BU
Liability disclaimer
-
Accuracy of Information
While every effort is made to provide accurate, clear, and complete information, the changing nature of laws and regulations may result in delays, omissions, or inaccuracies on this website. David Murrin does not guarantee that the website will be error-free, free from omissions, viruses, interruptions, or delays. The information is provided "as is" without warranties of any kind, express or implied, including accuracy, timeliness, and completeness. -
Liability
The information on this website is for general guidance only and does not constitute professional advice. Users should seek professional advice before making any decisions. Neither David Murrin Global Forecaster nor its associated companies—Apollo Analysis and Emergent Asset Management—accept liability for any loss, personal or business, resulting from actions taken or not taken based on the information provided. -
Hyperlinks
This website contains hyperlinks to third-party websites. David Murrin does not guarantee the accuracy or reliability of information on these external websites. Links to third-party websites do not imply endorsement and are provided solely for user convenience. -
Trading and Investment Risks
Trading and investing in futures, options, bonds, cryptocurrencies, FX, precious metals, and shares involve significant risks. Users must understand and accept these risks before investing. Do not trade with money you cannot afford to lose. This website and its content do not constitute a solicitation or offer to buy or sell any financial instruments. Past performance does not guarantee future results. Users should consult a financial advisor before making investment decisions. -
Use of Information at Own Risk
Users access and use the information on this website at their own risk. Global Forecaster does not guarantee the accuracy, timeliness, performance, completeness, or suitability of the provided content. The information is for educational purposes only, and errors or inaccuracies may exist. Global Forecaster excludes liability to the fullest extent permitted by law. -
Performance Results
Hypothetical or simulated performance results have limitations. Unlike actual performance records, simulated results do not represent real trading. These results may overestimate or underestimate market conditions such as liquidity. No representation is made that any account will achieve profits or losses similar to those shown. -
Definition of a Professional Investor
These services are intended for professional investors only—i.e., investors classified as professional clients or those who may, upon request, be treated as such, as defined by the FCA under Annex II of MiFID II. A professional investor has the experience, knowledge, and expertise to make independent investment decisions and assess associated risks. The FCA categorises professional clients into two main groups:-
Professional Clients
These are clients who automatically qualify as professional investors, including:-
Entities required to be authorised or regulated to operate in financial markets, such as:
-
Investment firms
-
Credit institutions
-
Insurance companies
-
Pension funds
-
Commodity and derivative dealers
-
Other institutional investors
-
-
Large undertakings meeting at least two of the following criteria:
-
Balance sheet total: €20 million
-
Net turnover: €40 million
-
Own funds: €2 million
-
-
National and regional governments, public bodies managing public debt, central banks, and supranational institutions.
-
Institutional investors whose main activity is to invest in financial instruments.
-
-
Elective Professional Clients
A client who does not automatically qualify as a professional investor but can request to be treated as one. To qualify, they must:-
Pass the Qualitative Test: The firm must assess that the client has sufficient experience, knowledge, and expertise to make investment decisions and understand the associated risks.
-
Meet at least two of the following three Quantitative Criteria:
-
Have carried out significant transactions (at least 10 per quarter over the last year) in relevant markets.
-
Have a financial instrument portfolio (including cash deposits and investments) of at least €500,000.
-
Have worked in the financial sector for at least one year in a professional role requiring knowledge of the relevant transactions or services.
-
-
-
Implications of Being a Professional Investor
-
Professional clients receive fewer regulatory protections than retail clients.
-
They do not benefit from certain FCA protections, such as best execution rules and some suitability requirements.
-
-
-
Subscriptions and Conditions
Subscriptions include The CIO’s Macro View, The Premium Macro View, Trade Executions, The Global Macro Package, and The Arkent Fund (“the Service”):-
Subscriptions and renewals require 100% advance payment.
-
The subscription period starts upon payment realization.
-
No refunds will be provided for subscription periods, even if terminated early.
-
Subscription renewals require mutual agreement unless stated otherwise in a separate contract.
-
Investment decisions are the sole responsibility of the subscriber.
-
Recommendations are based on market analysis but may change due to market dynamics. Global Forecaster is not liable for any resulting losses.
-
-
No Redistribution of Information
The services are intended solely for the subscriber. Redistribution, resale, broadcasting, or transfer of the provided information without prior written authorization from David Murrin Global Forecaster is prohibited. -
Sources of Information
Information provided through the services is obtained from sources believed to be reliable. However, due to the nature of electronic distribution, there may be delays, omissions, or inaccuracies. -
Compliance with Laws
Global Forecaster complies with all applicable UK laws and regulations, including but not limited to securities laws, insider trading, anti-bribery, modern slavery, corporate tax evasion, data protection, and anti-corruption laws. No material non-public information will be provided to subscribers. -
Intellectual Property Rights
All content on this website is the intellectual property of David Murrin and Global Forecaster unless stated otherwise. Copyright and all associated rights are reserved. -
Unauthorized Use
Unauthorized use of any website materials may violate copyright, trademark, and other laws. Website materials may not be modified, reproduced, publicly displayed, distributed, or used for commercial purposes without permission. -
External Links
This website contains links to other websites. However, this Privacy Policy applies only to personal data collected via the website operated by David Murrin Global Forecaster. We are not responsible for the privacy policies of other sites. -
Use of Email
While we take measures to protect communications to and from our website, we cannot guarantee the confidentiality of emails before they arrive or after they leave our systems. -
Payment and Acceptance
These terms apply to subscribers using the online payment services provided by Global Forecaster and its affiliates, as well as payments made directly via invoice and bank transfer. Authorising a payment is deemed acceptance of these terms. Global Forecaster reserves the right to amend these terms at any time. -
Confidentiality
Global Forecaster’s subscription services involve a one-way provision of information. We respect and uphold client confidentiality for consultancy services, specifically The External CIO and Murrin’s One-to-One services. -
Governing Law
This Agreement and any related non-contractual obligations shall be governed by and interpreted under English law. The English courts have exclusive jurisdiction over disputes arising from this Agreement.
Summary of Global Forecaster
Global Forecaster is a world leader in predicting geopolitical and financial market moves, leading to high alpha generation.
The Global Forecaster’s range of products has been designed to be the perfect adjunct to enhance CIOs and risk-takers investment returns. We provide a fully accountable real-time trade recommendation platform. This allows our clients to access the systematic trading inputs from an external Alpha-generating CIO, with 35 years of macro directional trading experience.
Recommendations are made based on pattern recognition techniques in some 5 sectors and 80 markets within the macro markets complex and 200 shares and are structured as a transparent real-time portfolio. Our strategies are published as CIOs Macro Views, which highlight the Geopolitical views contained in our Murrinations that should be included in the investment thesis. Coupled with our road map for the macro sector complex, and an analysis of each macro/share sector and how it interrelates with the other markets. Our financial analysis service then gives recommendations of trades that we are running and the new ones we will be looking to put on. Then every new trade recommendation is notified by an email alert, with a real-time trade with an entry point/stop level/size.
Macro Products
- Equities
- FX
- Crypto Currencies
- Bonds
- Emerging Markets
- Commodities
Global Forecaster Trade Recommendations
GF is structured to be a transparent real-time portfolio. With the strategy published as CIOs Macro Views, which heights the geopolitical views from the Murrinations that should be included in the investment thesis. Coupled with our road map and an analysis of each macro/share sector and how it interrelates with the other markets. The conclusion then gives outlines of trades we are running and the new ones we will be looking to put on. Then every new trade recommendation is notified by an email alert. With a real-time trade with an entry point/stop level/size.
The below table shows an example of a supermax long gold trade entered at the lows which as part of our major play within our precious metals strategy
- Numbers T16a to T 16c refer to 3 separate trade entry points 100% +100%+200% to make a total 400% sized trade
- Over 8 quarters up to the end of Q320, gold has made over 420 trade units (trade sizes are normally from (33%) =3.3 units to (200%)= 20units. Only once in 12 months or so would we make a (400%)40 unit recommendation, like the one in play at the moment.
- Note that the market to market (in yellow) recommendation T16a to c is up 300 units this quarter-which is a whooper of trade. And makes a total return in gold of 720.5 units 40 unit over 8.5 quarters.
Image
For Silver, the returns were even greater.
- Over 8 quarters up to the end of Q320 silver has made over 598 trade units
- Note that the current recommendations T22a,b,c, are now up 386 units for this quarter which makes silver the highest return of all 80 of the macro markets that we trade and track at 985 units over 8.5 quarters.
Image
Every quarter we then publish our results for every sector and every market and a summary of our top 15 best markets at the end of each quarter. Showing our consistency and breadth of coverage.
Image
Portfolio Construction
From this system, we can build any portfolio according to the market and sector and the risk allowance.
Eg a simple silver plus gold portfolio that equated to risking 0.5% per 10 trade units would have made
Gold(720 units) plus silver (985.1 units)=42.2% over 9 quarters
never risking more than 1% at any one time, except the last current trade that risked 2%
These are significant risk-adjusted returns.
Furthermore, we can build any portfolio of any composition using this process in both Macro markets positions.
Who is this for?
This service is for:
- Banks
- Pension Funds
- Resource and commodity companies
- Hedge Funds (Macro and Long/short)
- Corporate Treasuries
- Family Offices
- HNWIs
What is the basis of David's analysis?
David developed a unique and effective set of behavioural models to predict financial markets, whilst at JPM, which were extremely effective and profitable. They acted as the foundation for his 20-year career as a CIO of his hedge fund Emergent. With some remarkable returns in the most bearish of markets (e.g 84% in 2008 - see track record).
What analysis can I get?
David provides two types of market analysis:
- The CIOs Macro View - These are the integration of all elements of our market views into one coherent strategy and perspective. Integrating price models and our Geopolitical perspectives (Murrinations) into a single holistic predictive perspective. They are updated as and when major market events provide new information, which is on average once or twice a month. (Formerly Arkent Scenarios, named after the Ark and severity of the next expected global economic downturn.)
- Macro Trade Executions - This service is designed to provide long-term and medium-term investment outlooks and specific executions in a range of markets outlined above. Updates are sent out real-time as and when the market moves require.
Do you offer different subscription options?
Yes. David offers a number of different levels of subscription to meet your needs and budget, on a 3 or 12-month basis.
How do I gain access to the analysis?
Once subscribed you can login to the site and view the analysis in a secure area of the site.
Click on the Pricing tab to view the costs and subscribe now.
David Murrin has been a macro trader since 1986, first working at JPM on its first Prop desk and then as a founder and CIO of his Macro and Emerging Market Fund, Emergent Asset Management, for over 20 years. During that time he has had a remarkable track record of predicting major market declines and profiting extensively from them. Short at the highs and then running with the decline in the 1998 Asian Crisis, the 2001 dot com bubble, the 2003 Argentine crisis, the 2007 bear market, the flash crash of 2011, last but not least the February 2020 pandemic risk-off crisis. However, his work not only accurately predicts these big dislocations and but also then focuses on the safe periods to then extract risk-off Alpha. Subscribing to Global Forecaster is effectively akin to having access to an outsourced but very experienced CIO, with a uniquely successful track record.
Global Forecaster provides one of the broadest and most accurate tools for predicting geopolitical events and financial reversals and trends. This is achieved by the integration of two unique behavioural models which act as independent long-range search radars, de-risking against shocks and finding low-risk and high-return trading opportunities and strategies to maximise investment returns. Both models are based on the mosaic gathering of multiple elements of information that, when integrated, create remarkably accurate predictions. Our results speak for themselves: our two long-range search radars are based on:
- Our geopolitical predictions are generated from our theories including Dyslexic Strategic Thinking in conjunction with human collective behaviour. The Five-Phase Lifecycle, the Polarisation Process, and the Commodity K cycles allow us to predict national behaviours such as the path of the Brexit process, the path of American decline and the aggressive rise of China in considerable detail. These models have allowed us to predict every UK and US election result accurately for the past 20 years and accompanying foreign policy changes and focuses. Having built a baseline of global geopolitics, we can quickly detect new factors that will have profound impacts on geopolitical and financial markets, e.g. on 5th January 2020, we accurately predicted that the Wuhan epidemic would become a global pandemic. Most of all, our model allows us to look at the impact of cycles that have a longer wavelength that can be detected in the price history of modern financial markets, such as the decline of the Western Christian Super Empire.
- Our pattern recognition models are applied across the whole global market complex. Global Forecaster uses a probabilistic pattern recognition system which is applied to over 67 markets. This includes 23 Equity indices, 22 FX pairs, 6 bond markets, and 16 commodity markets, and also over 100 individual shares. Our Wave counts are in effect a language to describe market behaviour by identifying patterns over multiple timeframes, to locate reversal points that then unfold into longer-term trends, providing multiple risk-return profiles. Each market is then correlated to others in their sector, to confirm the pattern quality, and then sectors are compared to other sectors to create integrated roadmap scenarios that give further certainty to our predictions.
Having constructed a clear image of the expectations of markets, we apply our fire control radar to apply specific risk recommendations across specific sectors and markets that can be combined into effective portfolios for Alpha-generating strategies.
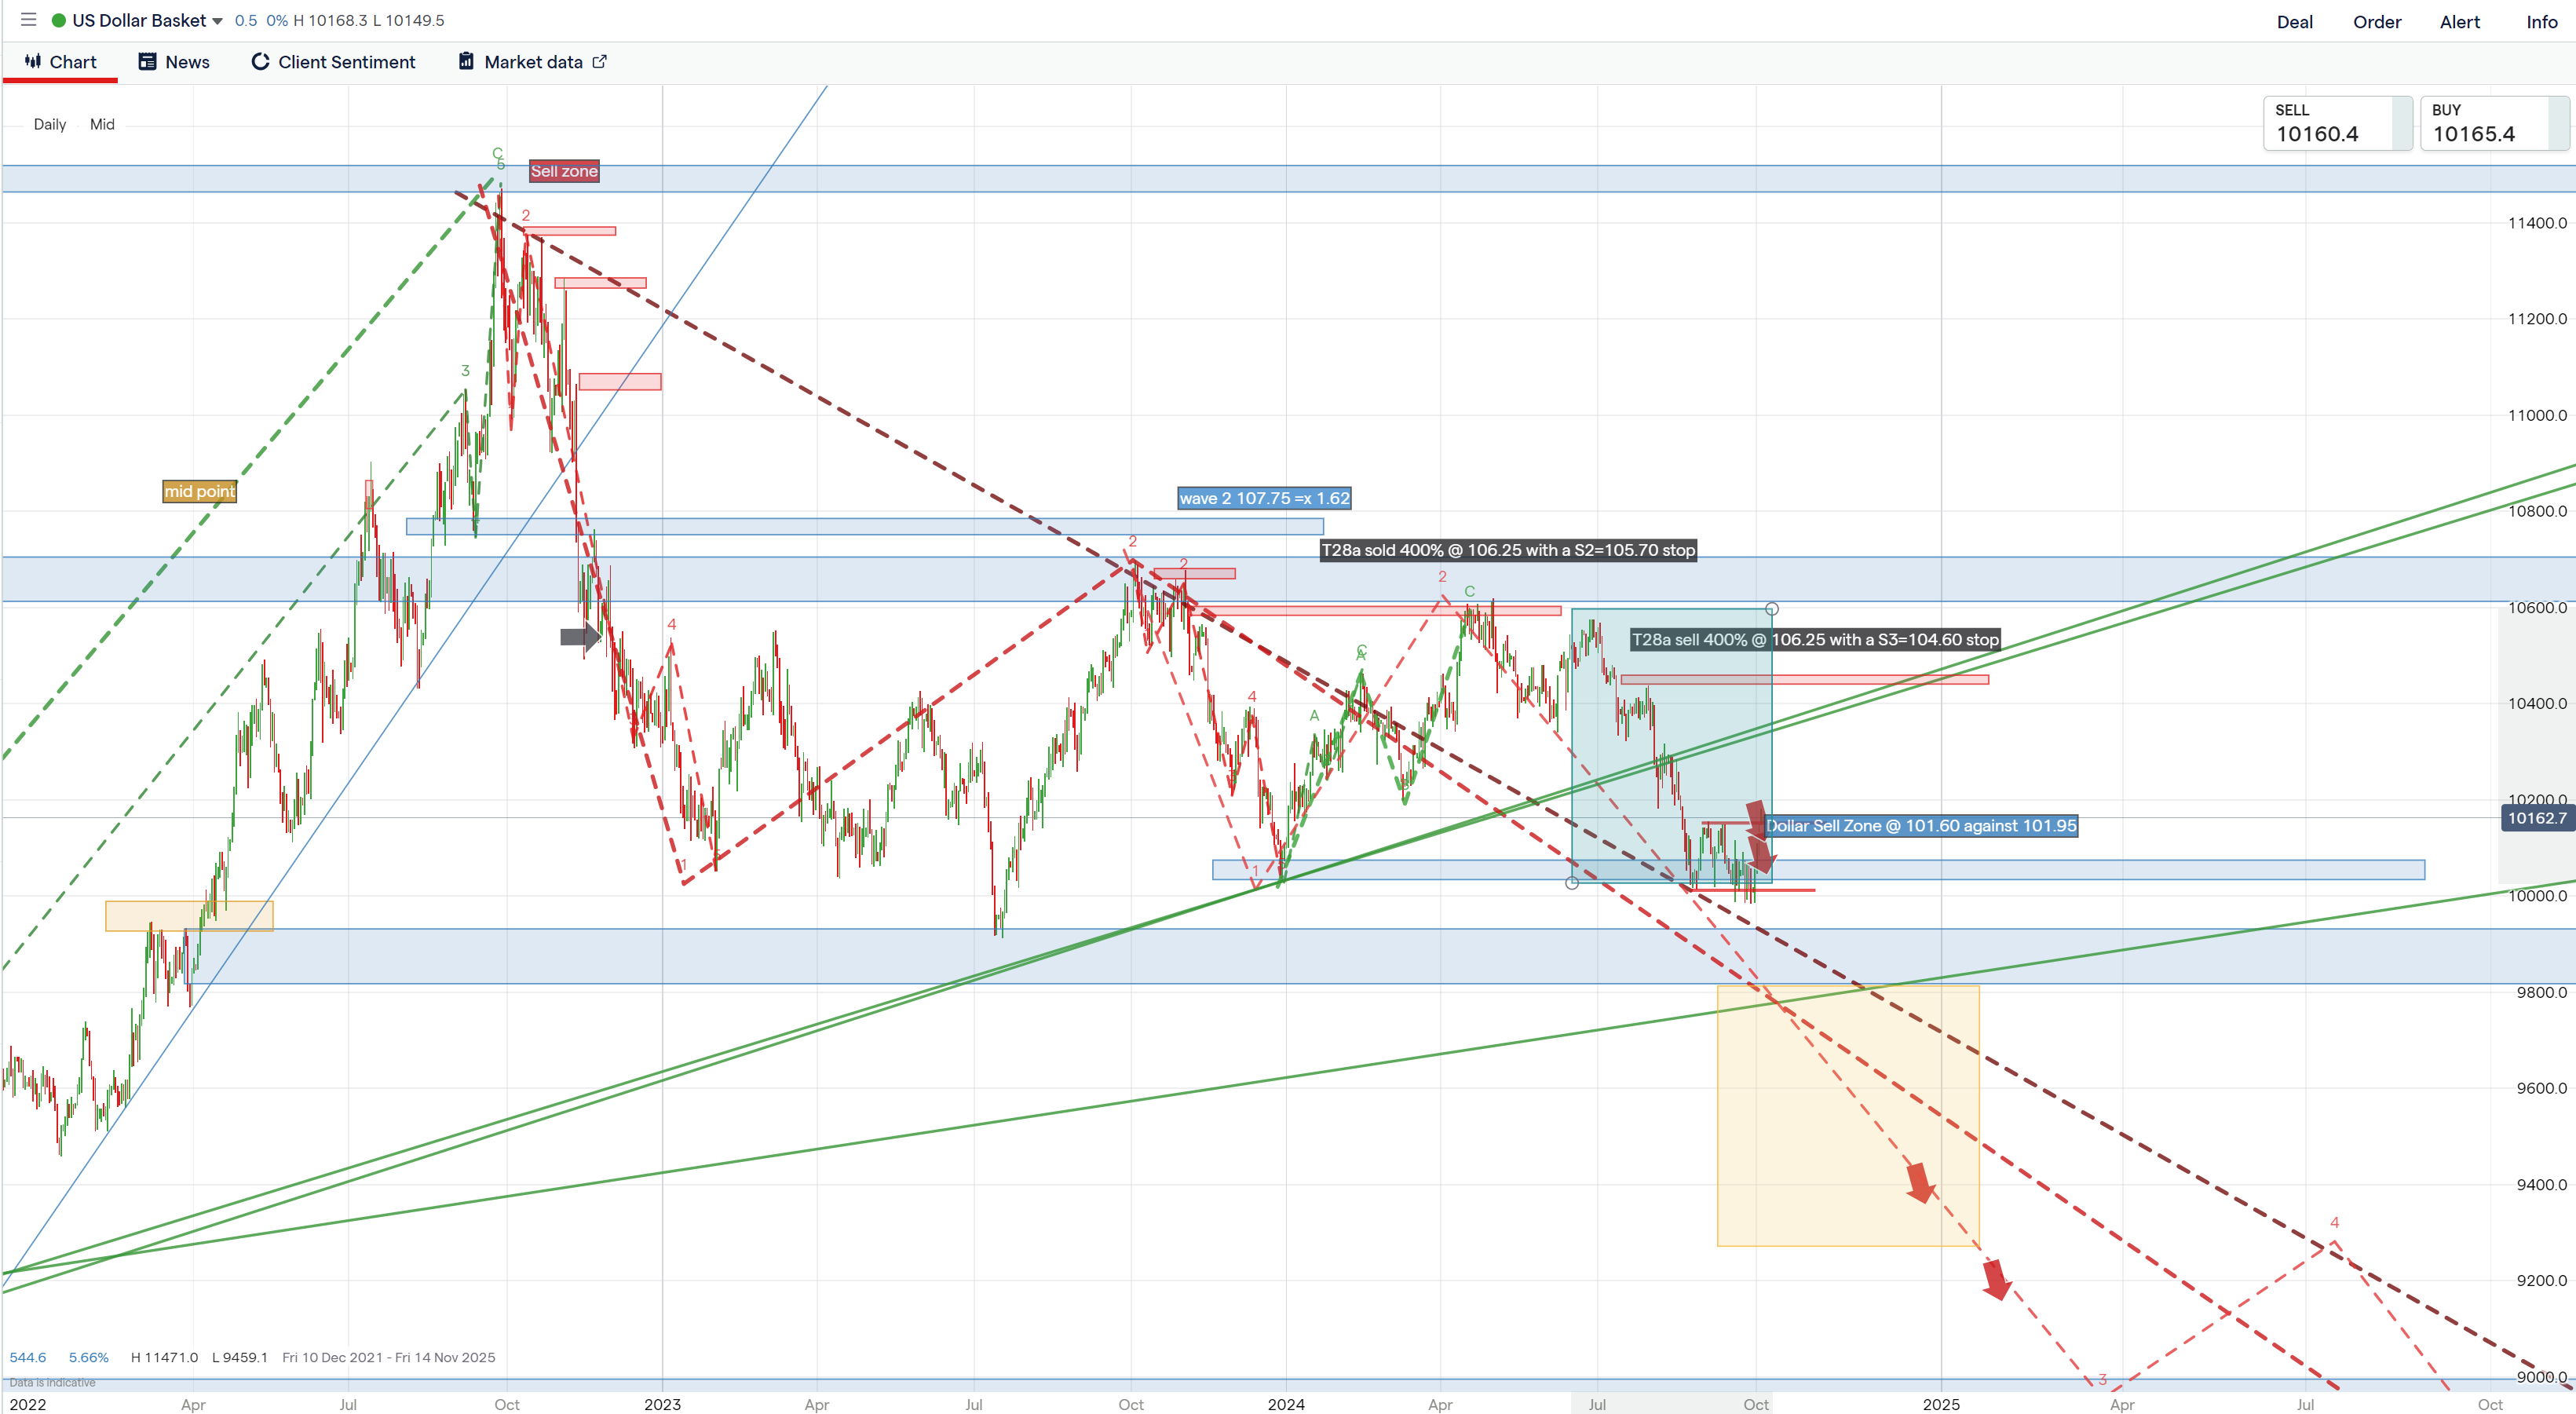
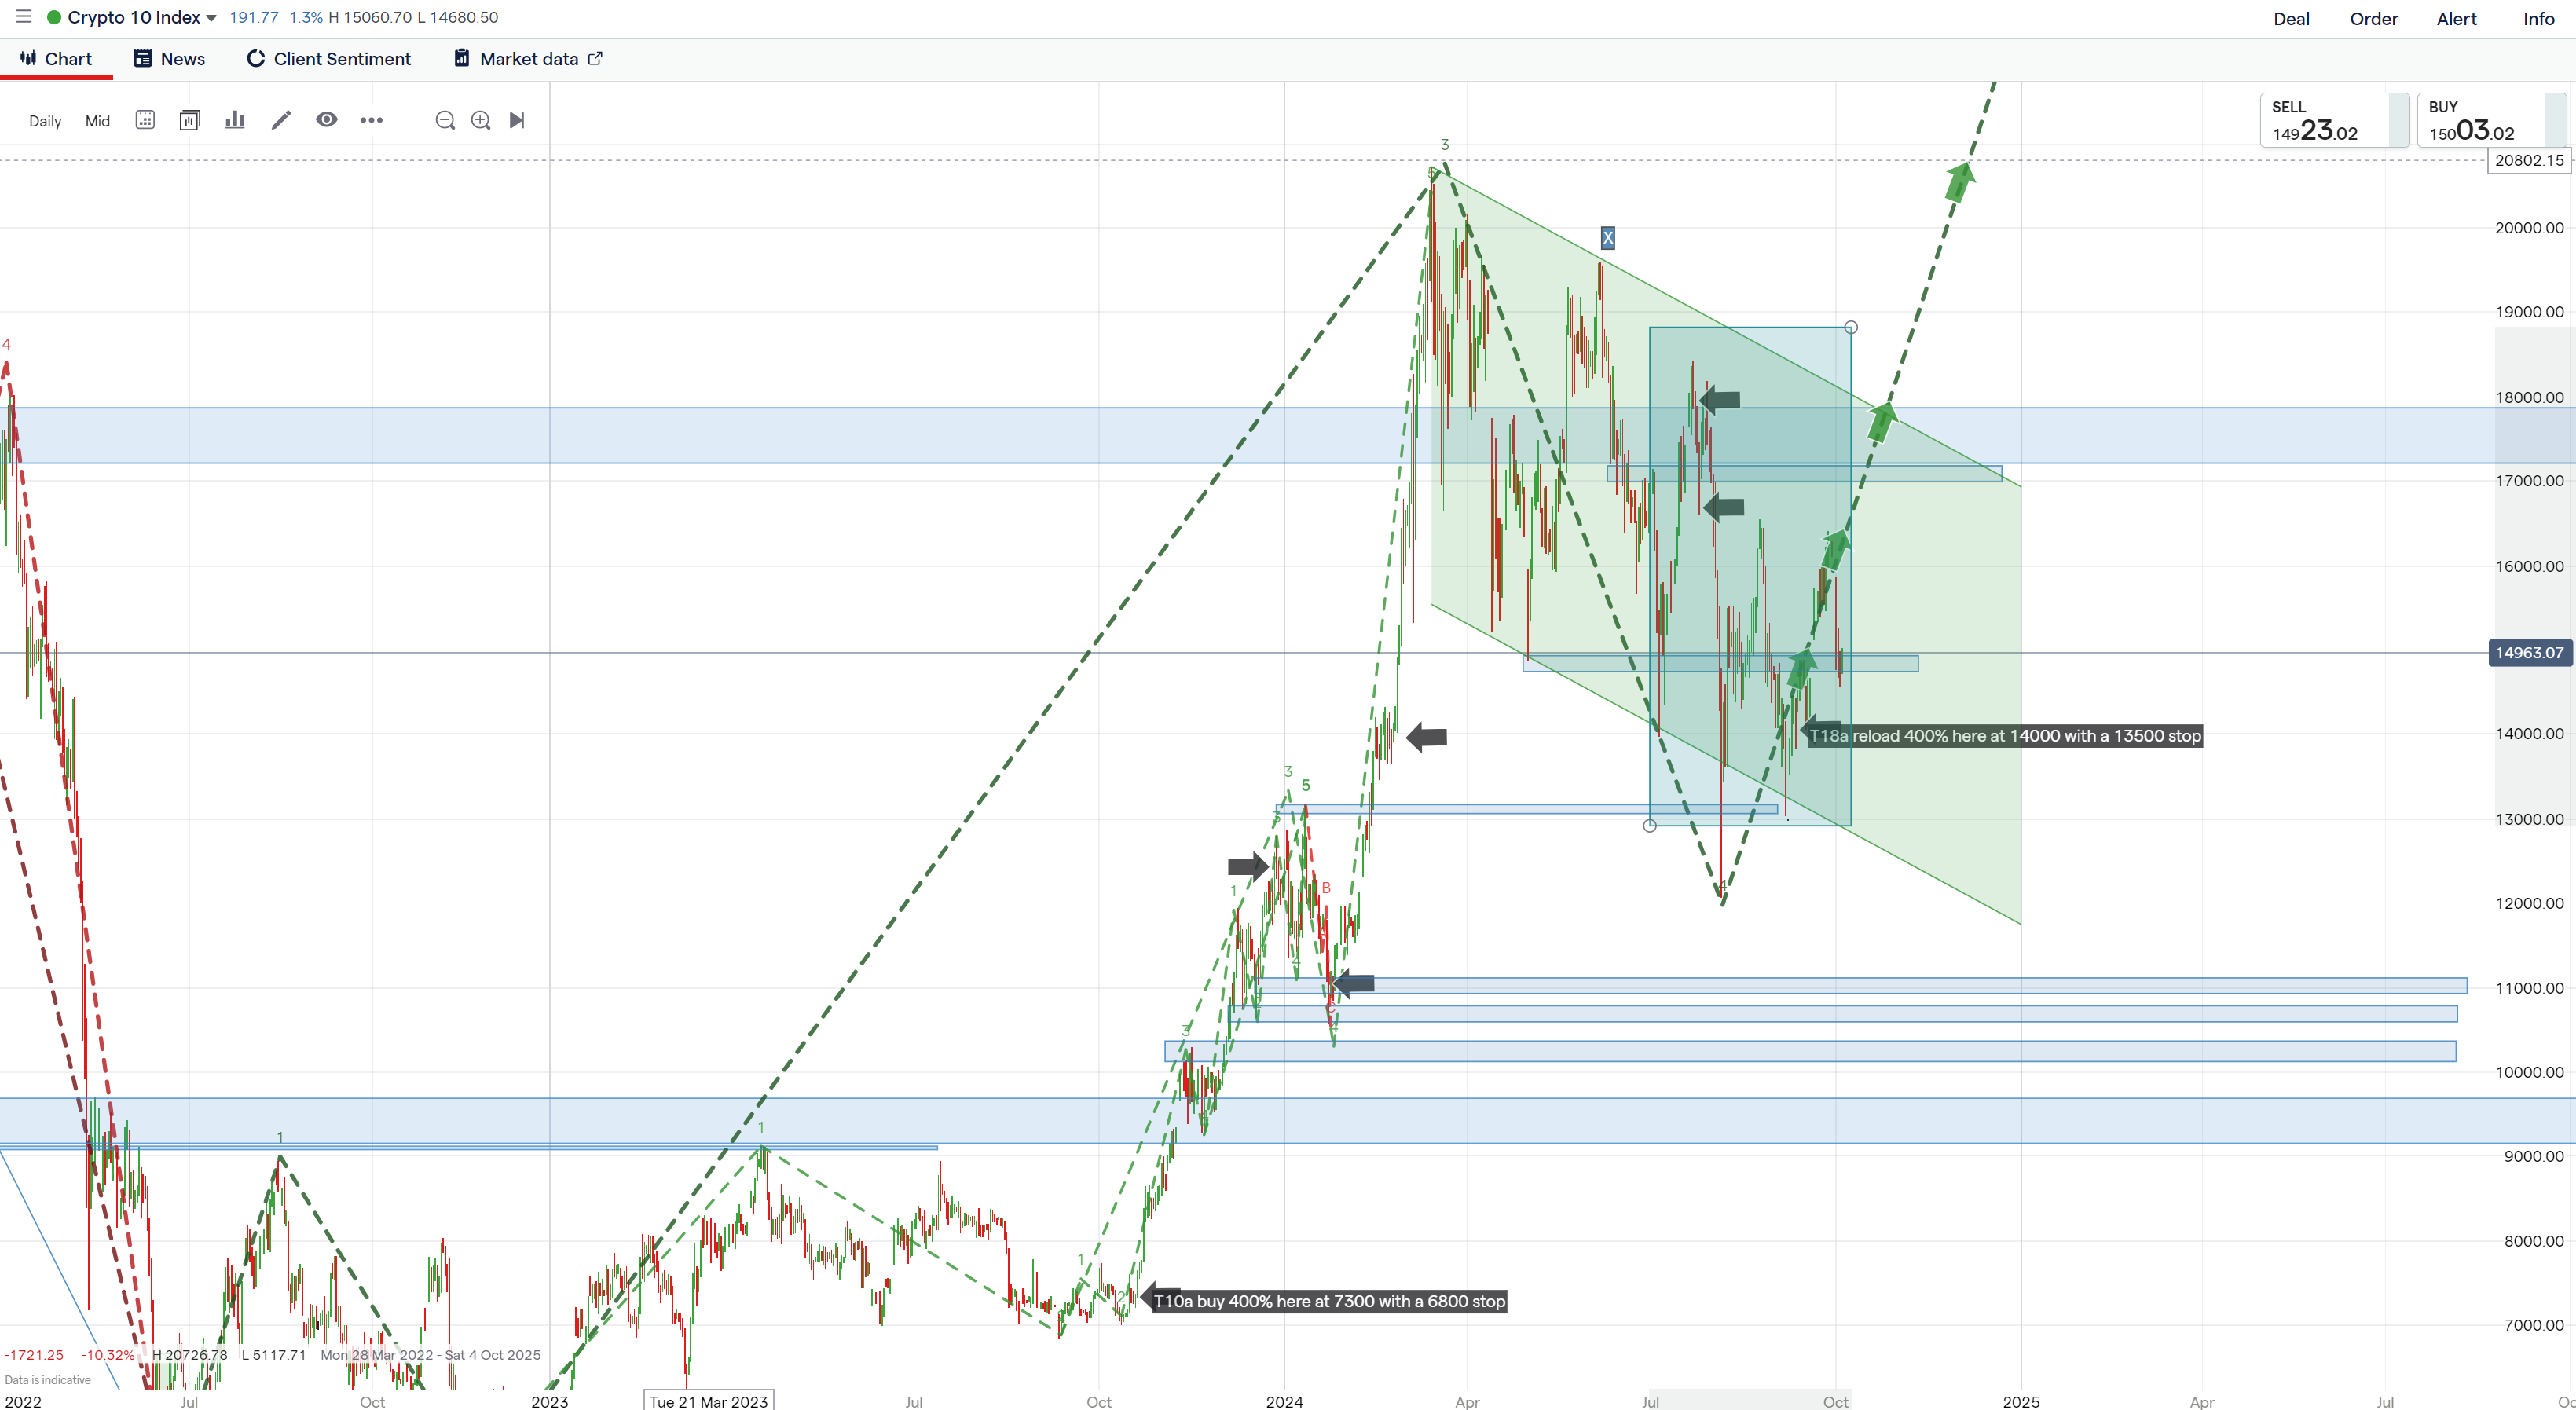
- We make specific real-time risk-adjusted trade recommendations, with entry points and stops, and recommended sizes relating to our evaluation of the quality of the trade (ranging from 33%, 66%, 100% 133%, 166%, 200%). The results are then published at the end of each quarter so that our performance in various sectors can be evaluated by our clients, allowing them to assess the reliability of our forecasts and the quality of our returns. New trades are sent within five minutes of publication to clients’ emails, providing actionable real-time trade recommendations. This is ideal for risk-takers who seek specific trade recommendations with precise low-risk-high-reward entry points. The sequence of Gold trades below shows our process.
Click a chart to view a larger version.
Please use the tabs above to view our USP, a sample CIOs Macro View, quarterly appraisals, testimonials, FAQs and our full list of prices with links to subscribe.
I have known David since 1988 when I headed Sterling Eurobond trading at JPMorgan in London. David was then and remains a polymath whose fascination and study of behavioural patterns is prescient. His track record, available on his website Quarterly performance appraisals, reveals his accuracy in pinpointing entry and exit points for his lateral views of markets, geopolitical events and human behaviour. Following his initial success as one of the first proprietary traders at JPM, David was asked to set up and run a price-based market analysis group. This was an innovative and bold move for a traditional and highly conservative operation. What impressed me most about David was his independent and lateral analysis. Never one to be carried along by the crowd David saw patterns that others did not which were portents of market moves. My interactions with David at JPM led to a long and enduring relationship with him that continues nearly 35 years later. During that time I have watched him develop and improve his market behavioural models to their current form. Whilst no market predictor will ever be right one hundred per cent of the time David's consistency and his risk-reward approach as revealed in his audited results, are compelling. The precision of his entry points for trades which provide low-risk trading opportunities are reflected in his quarterly published trading results. His insights are extremely valuable and alpha generative, across not only the main market sectors but individual shares. Whether your interest is in predicting market movements, geopolitical events or behavioural modelling David’s book Breaking the Code of History was and continues to be groundbreaking and has inspired many coming after him to explore David’s compelling analysis.
Dominic Price is a veteran banker who worked for JPMorgan for over 25 years including in several senior roles in Asia and was a subsequently a Senior Advisor to JPMorgan. (January 2023.)
David, your fully integrated work combining global geopolitical historical perspective, overlaid with a keen understanding of the inner working of financial markets, provides a level of wisdom that is rare. The quality and depth of research is invaluable to leaders across the political, corporate and investment disciplines.
Satish Rai - Chief Investment Officer OMERS Pension Fund Canada
David Murrin is an amazing geopolitical and macro thinker. He was my consultant while I was at Exoduspoint and one of the few non-linear thinkers who could provide real alpha.
Antonio Fortes Senior PM
I have known David for over five years and, during that time (all documented) he has predicted the rise of Trump, every twist and turn during the three-year course of Brexit, including Boris becoming PM (a year before he did), and the landslide election result.
Rob Hersov - Chairman of Invest Africa
On January 30th he called me and really panicked me (I have all the WhatsApp’s to prove it), which made me dump most of our family equity portfolio and move into cash. He has saved us a large fortune!
When no one was looking, in early January, he warned that the Wuhan Flu was going to become a pandemic that would bring the global economy to a dead stop. Simultaneously he predicted the drop of oil from $65 to sub$27 and the collapse of the stock markets. All these predictions were in papers he wrote, and speeches he gave (some at my Invest Africa events), and most people then thought him mad. How silly (and poor) they look now.
Bill Blain - Investment banker and market commentator
I will state from the outset that I generally shun predictions and, by extension, am suspicious of those that claim to see the future. Nonetheless, while David refers to “predictions” on his website, I believe that these are better described as an interpretation of geopolitical conditions through the prism of his Stages of Empire theory. This has enabled David to consistently make seemingly outlandish but remarkably accurate interpretations of current events and, by extension, market calls. Given his interpretative framework, I see no reason why David’s analysis should not remain as consistently accurate for many years to come.
Andy Pfaff - Chief Investment Officer | Coherent Commodity Investment (Pty) Ltd
Many thanks for your Valuable advice on positioning in different asset classes.
Prakash Shirke - CFA Investment Adviser
Recalling our meeting at a Hannam and Partners dinner and subsequent lunch, I have regarded you as something of a sage as you predicted both the Trump victory and Brexit referendum as well as the market meltdown which we have witnessed over the past week or so.
John Battersby - Director of the South African Chamber of Commerce consultant/journalist/author
Several years ago I had the fortune of meeting David Murrin through Rob Hersov. David captured his audience with his candid dialogue, no frill content and a wit that equaled his exceptional insights. His ability to leverage off historical context and provide relevance to the current global political arena had his audience spellbound. I would recommend David as both a speaker or VIP dinner guest at any table.
Ariella Kuper - CEO Solution Strategists Pty Ltd
I don’t know enough about charting to make much of it myself, but I’ve seen enough to recognize the repetitive nature of market-driven behaviour. Market patterns do repeat and are therefore worth paying attention to. For instance, for a superb overview, take a look at David Murrin’s website. His global forecasts and commentary is worth a sign up to run through his chart-supported outlook and reading of the underlying forces at play
Bill Blain - Morning Porridge and Shard Capital
David Murrin is a long time friend as well as a very special investor. He brings to the 21st century an enormous amount of experience as well as knowledge. We live in a very difficult environment. He is in invaluable.
Johnathan Smith Founder - Chesapeake Asset Management
David Murrin is one of the best global macro forecasters I know, do sign up for his newsletter… ...he is an outstanding human and one of my favourite people in this industry
Anric Blatt Managing Partner - involved with hedge funds and the #FinancialPlanning community since 1994, has done due diligence on 15,000+ funds and has been an investor in thousands of them
You were spot on your forecast of the Tory majority when I spoke with you 2 months before the November election. You were spot on with your forecast months before the Covid-19 pandemic of what impact it would have on the global economy and I did not believe you ! You have been spot on with gold and commodity prices.
As you know, I tend to always look on the bright side of life and try and believe that disasters will be averted but this pandemic and the global economic partial paralysis is an event which I never thought I would experience in my lifetime and clearly will have disastrous economic ramifications for the medium term.
Retrospection can teach us all lessons but the accurate vision for the future is a rare talent.
Lord St. John Anthony - 22nd Baron St John of Bletso is a British peer, politician, businessman and solicitor
Quite often, those of us continuously trading in the markets tend to get lost in the noise and pay less attention to the major geopolitical issues that will shape the global economy for years to come. These geopolitical transformations are happening now. David is there to help you bring these issues into focus and help you think outside the box. We've had numerous in-depth discussions on how these transformations will impact not only our portfolios but our lives in general.
Antonino Fortes Senior Portfollio manager


Individual Macro Market Analysis & Forecasts
The CIOs Macro View
If you’re interested in David’s strategic market perspectives, then this is for you.
These strategy updates are titled The Macro View, formerly Arkent Macro Scenarios, named after the Ark and the severity of the next expected global economic downturn.
1 month - £1500
Immediate access to Murrinations Insights, on the website, as well as updates via newsletter alerts. David writes about geopolitics, national security/military, history and financial markets. Worth £500 p.a.
View an example post
Access to The CIOs Macro View - unified strategic market perspectives, within a secure member’s area on the website. Also sent in a newsletter, within minutes of publication to the website.
View an example update
Access to David’s Macro Trade Executions - real-time trade recommendations across Equity Indices, Companies, Crypto Currency, FX Bonds, precious metals and commodities, within a secure member’s area on the website. Also sent in a newsletter, within minutes of publication to the website.
View an example execution
Receive analysis on a minimum of 1 sector and all indices within - View all available market sectors
£1500 per month
+ VAT UK ONLY
The PREMIUM CIOs View
In addition to David’s strategic market perspectives, titled The CIOs Macro View, this package will give you David’s invaluable real-time trade executions, including charts and market outlooks.
Choose at least one sector from Stocks, Crypto Currency, FX, Bonds, Emerging Markets or Commodities, and receive real-time updates and forecasts.
1 month - £2200
Immediate access to Murrinations Insights, on the website, as well as updates via newsletter alerts. David writes about geopolitics, national security/military, history and financial markets. Worth £500 p.a.
View an example post
Access to The CIOs Macro View - unified strategic market perspectives, within a secure member’s area on the website. Also sent in a newsletter, within minutes of publication to the website.
View an example update
Access to David’s Macro Trade Executions - real-time trade recommendations across Equity Indices, Companies, Crypto Currency, FX Bonds, precious metals and commodities, within a secure member’s area on the website. Also sent in a newsletter, within minutes of publication to the website.
View an example execution
Receive analysis on a minimum of 1 sector and all indices within - View all available market sectors
£2200 per month
ADDITIONAL SECTORS + £1000 PER MONTH
+ VAT UK ONLY
GLOBAL MACRO PACKAGE
David’s global package is for anyone who needs David’s strategic market perspectives, updates and forecasts for all sectors: Stocks, Crypto Currency, FX, Bonds, Emerging Markets and Commodities.
You’ll receive real-time updates and forecasts as and when the markets changes, giving you predictions on when to make your move.
1 month - £5000
Immediate access to Murrinations Insights, on the website, as well as updates via newsletter alerts. David writes about geopolitics, national security/military, history and financial markets. Worth £500 p.a.
View an example post
Access to The CIOs Macro View - unified strategic market perspectives, within a secure member’s area on the website. Also sent in a newsletter, within minutes of publication to the website.
View an example update
Access to David’s Macro Trade Executions - real-time trade recommendations across Equity Indices, Companies, Crypto Currency, FX Bonds, precious metals and commodities, within a secure member’s area on the website. Also sent in a newsletter, within minutes of publication to the website.
View an example execution
Receive analysis from all sectors and all indices within - View all available market sectors
£5000 per month
+ VAT UK ONLY
The Arkent Fund
The Arkent fund is Global Forecasters unleveraged fund, that provides subscribers with our real time management of the Portfolio, with changes sent out real time. The rational behind the fund comes from or CIOs View product.
The External CIO
A bespoke service that integrates every aspect of The Global Macro Package subscription with the risk-taking aspects of our client's portfolios through personnel discussion and interaction. This also includes objective support with respect to the harnessing of trading psychology to maximise profitability. A useful tool to maximise returns when under pressure from losses, or indeed after having an excellent run of profitability.
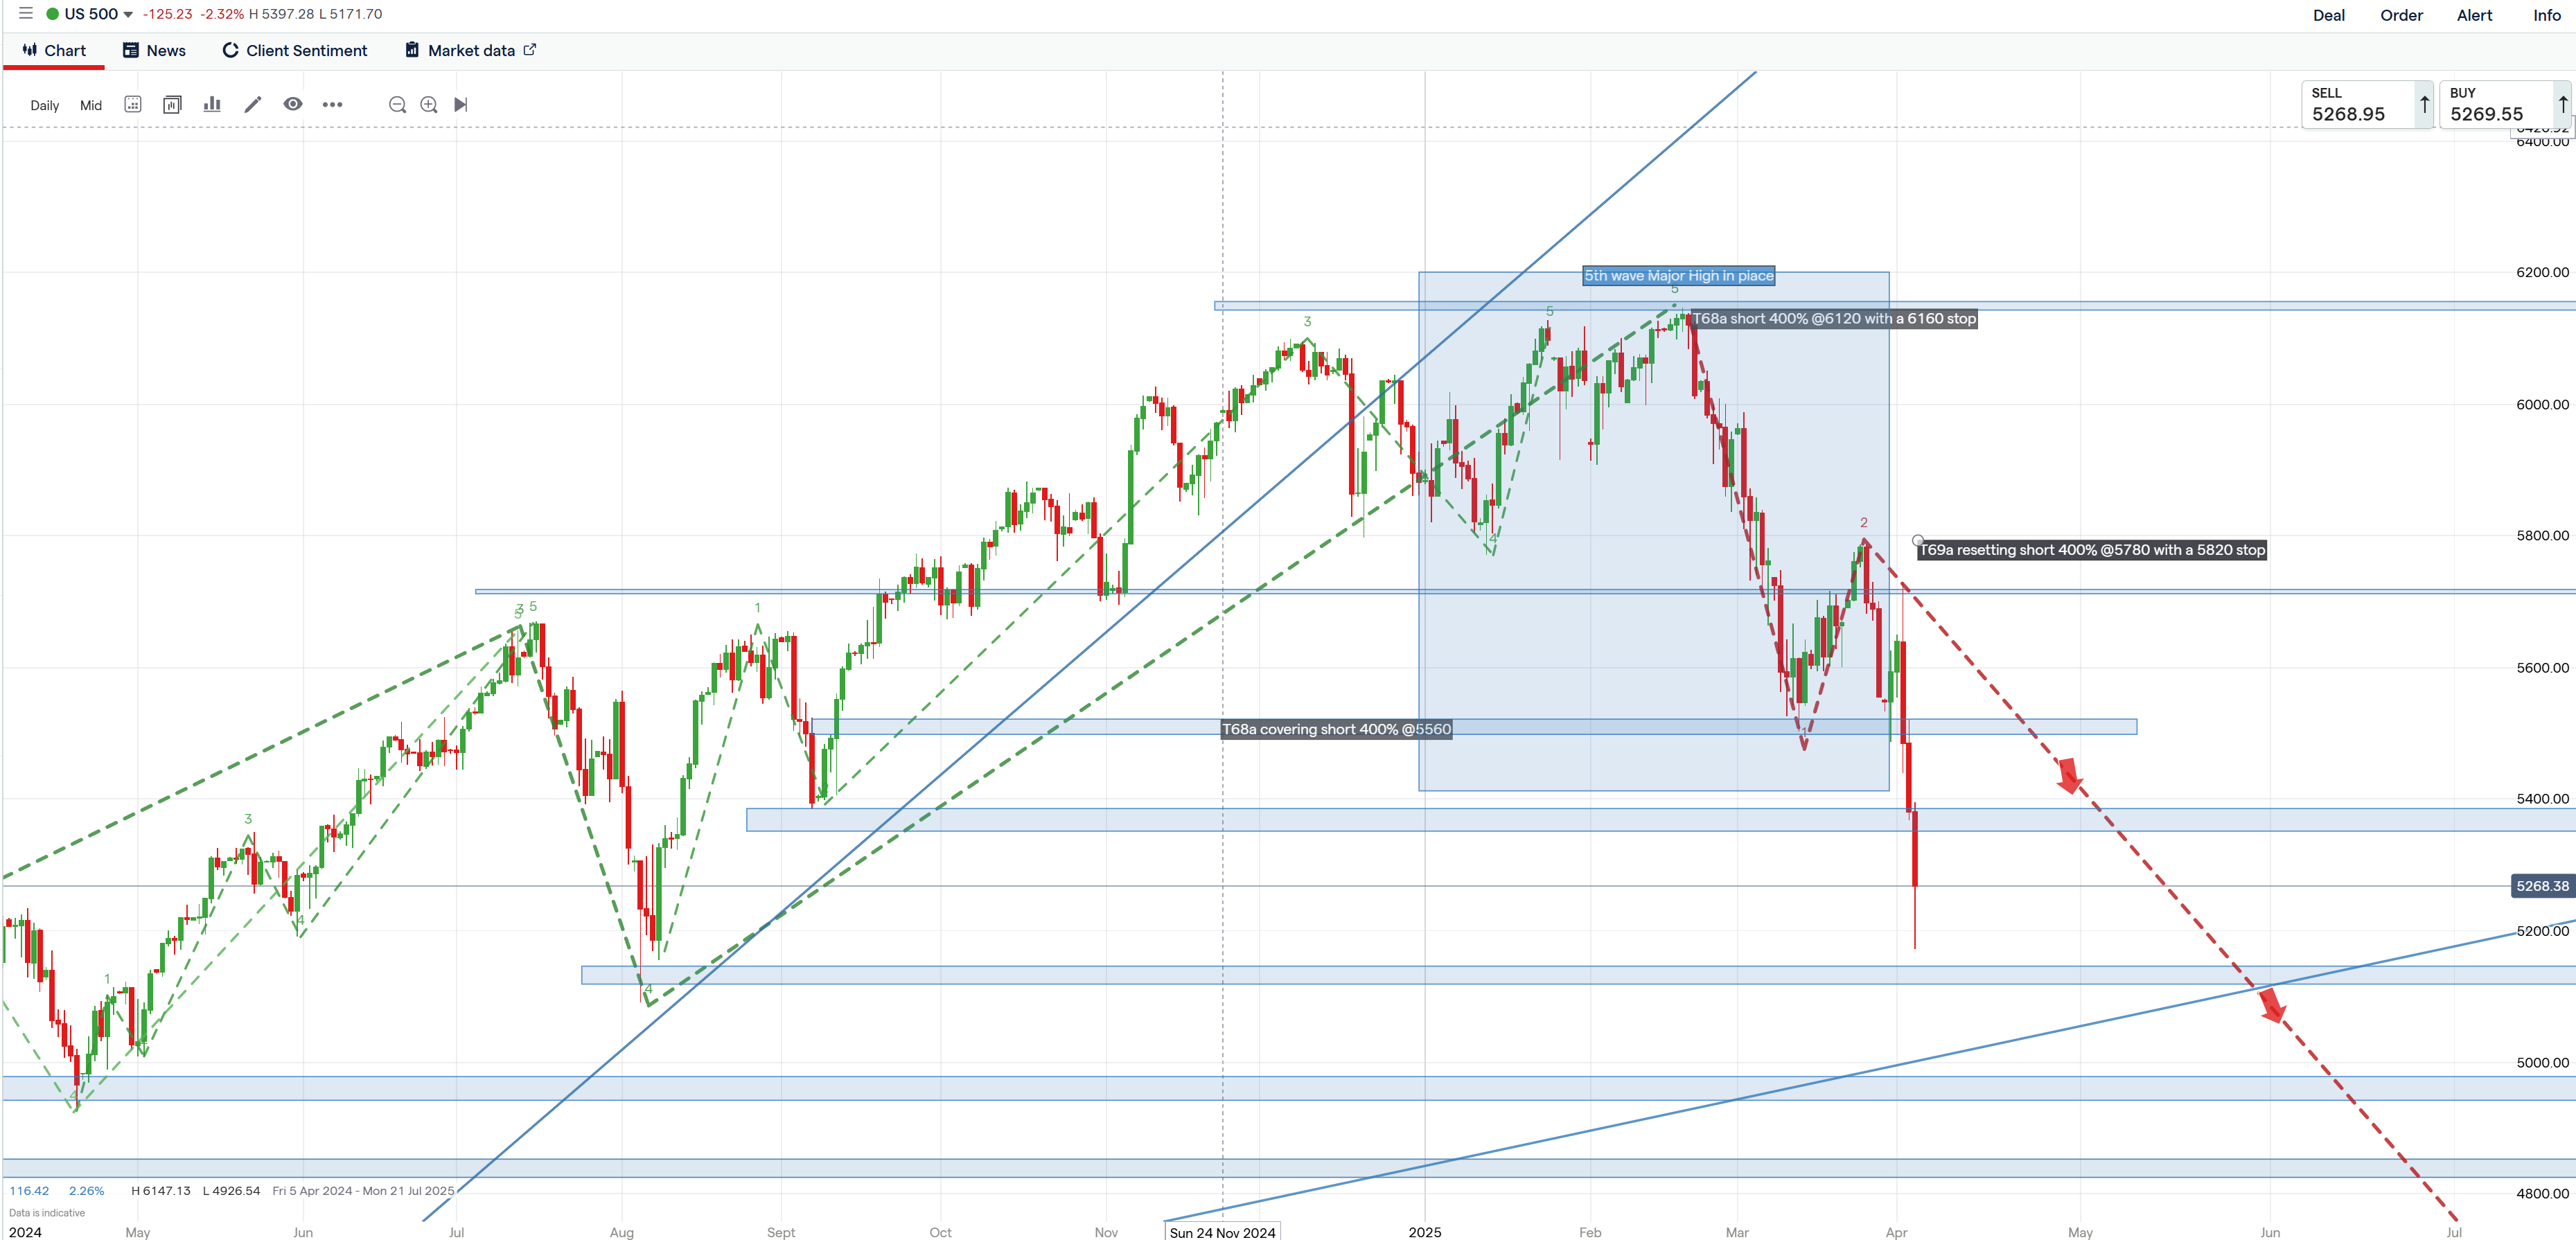
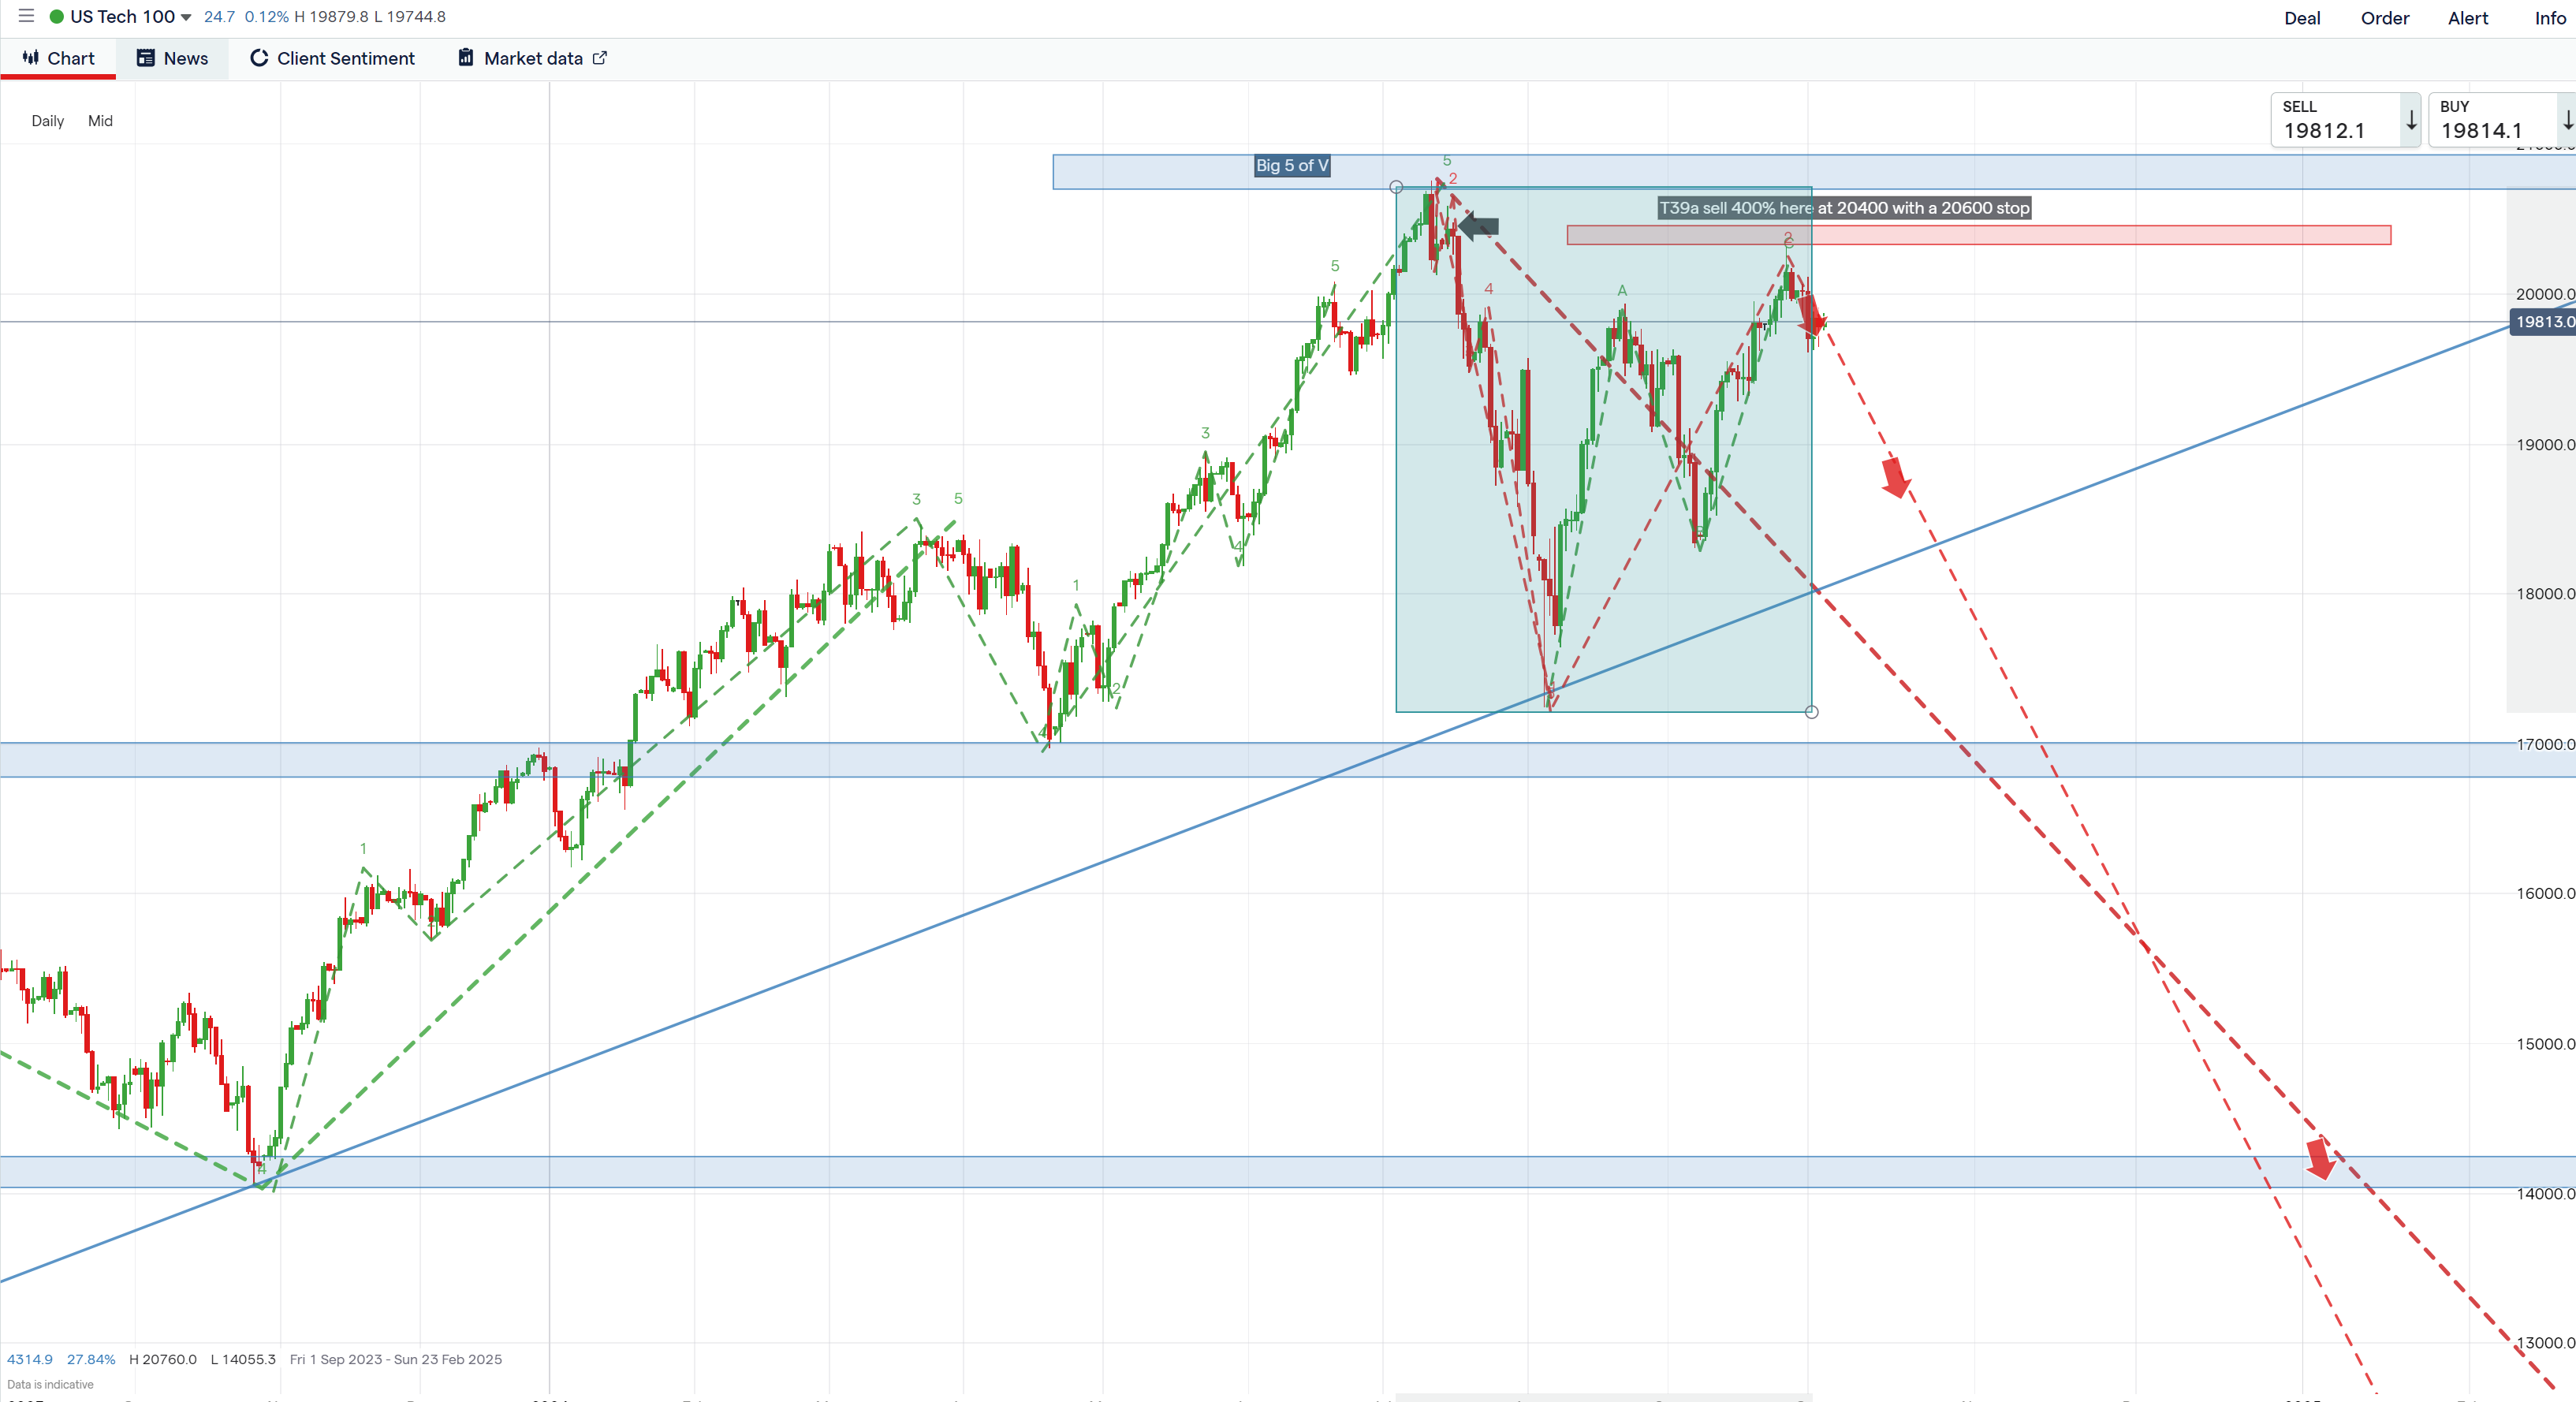
Arkent Scenario; Heads Up Phase 3 is Accelerating
Image
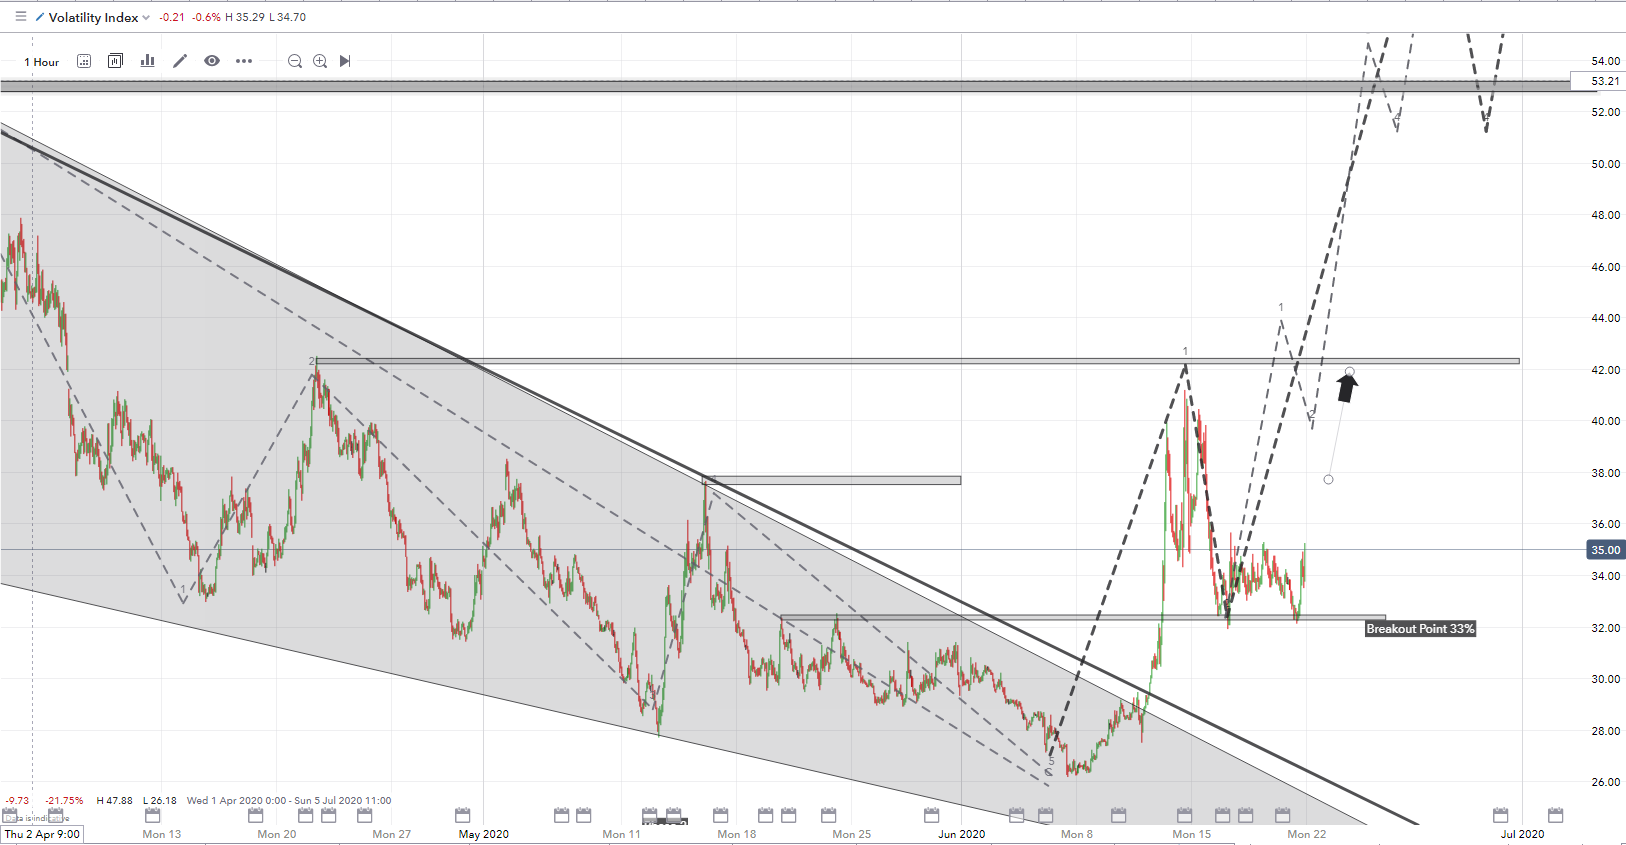
Above is the Vix Chart that is running on rails. Expect a major upwards move in Volatility next week. As the wave 3 accelerates
Although last week might have seemed relatively quiet I believe that it has set the scene for some very big weeks ahead as our Phase 3 scenario begins to move into reality. The five crises of American decline are all in play and any one of them can appear from nowhere. Most of all I believe that with the perception of the Fed PUT making investments an apparent dead cert, everyone is max long and only a few smart investors are boldly short. The longs are in my view the walking dead.Note the risks of a stock market crash decline are extremely high, as delusion andreality meet.
1. Bond Markets
Look set to break to the upside in price in Bunds and US T Notes. This will be a dash to negative yields from the current 0.7% to -0.3% as the reality of the US economic collapse hits home. Note the bond market is much smarter than the equity market. Breaks only ½ appoint higher should see accelerations to the upside. However once yields have gone negative the next phase will be a sovereign debt crisis due to the hugh debt levels incurred by the response to the pandemic compounding the already high debt burdens. As reported in the Guardian today.
Britain’s public debt is larger than the size of the country’s economy for the first time since 1963, after the government borrowed a record £55bn in May.
The total level of debt has risen by £173bn over the last year to reach £1.95tn, or 100.9% of GDP, as ministers introduced unprecedented support for businesses and households during the coronavirus crisis.
The UK joined Italy, the US and Japan in the club of nations with levels of borrowing higher than their national income as the latest Office for National Statisticsfigures showed the UK government borrowed £55.2bn in May, roughly nine times more than the same month last year and the highest monthly borrowing since comparable records began in 1993.
2.Gold and Silver
Look ready to break higher with Bonds. After a period of lateral corrections, I expect these two metals to truly surprise in the strength of their rally in the week ahead.
3.The Dollar.
Has been in a lateral correction, but I expect that the trend of the decline of the dollar will continue next week. Especially as the move to negative rates removes and Dollar carry advantage.
4.Emerging Markets
The MSCI along with other EM stock markets has been very correlated to the SP500 and similarly is ready to decline from current levels in the Phase 3 decline. What is fascinating is that the Dollar/Em currency pairs turned earlier than the stock markets complex by a week and have been coiling for a major upside break (EM currency weakness) to new highs.
5.Commodities
Have been behaving like equities with coincident timing and they two finished their wave 2s on Friday so should drop in the days to come.
6.Individual Equities.
We are keen on three sectors.
- Long gold and silver stocks as they are set to sore so max positions here.
- Short the banking sector will suffer very heavily with the negative rate move.
- Short oil stocks will have a powerful drop as oil falls once more to below break evens.
Of note is that Tesla looks to have made a high and reversed (we are short) and all the strong US stocks that drove the corrective rally are now reversing.
7.Equities.
Our scenario that OUR Phase 2 high was on 9/10 June looks stronger at this week's end.
Last week was in essence the wave 2 correction week, with a powerful rally that conformed to expectations of an irregular pattern that got every bull in town hot and excited. The mantra I heard all week was, see I told you you could not fight the FED and ECB! What fascinated me however was that no one seemed to realise that the price was lower than the major high of June 9/10th so why were they so bullish? Because wave 2s are all about giving the impression that the previous trend is intact, ie in this case the bull is in play. However Fridays drop is the start of wave 3 and whilst initially, the bulls will think they are right the impending falls below critical levels on the downside will begin to change this psychology. Expect a negative next week with price accelerating to the downside as it progresses. Note the risks of a crash decline are extremely high, as delusion andreality.
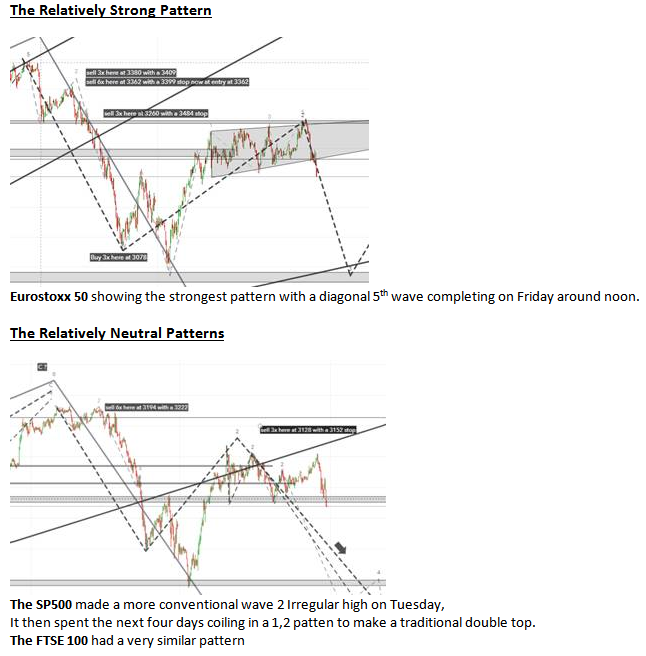
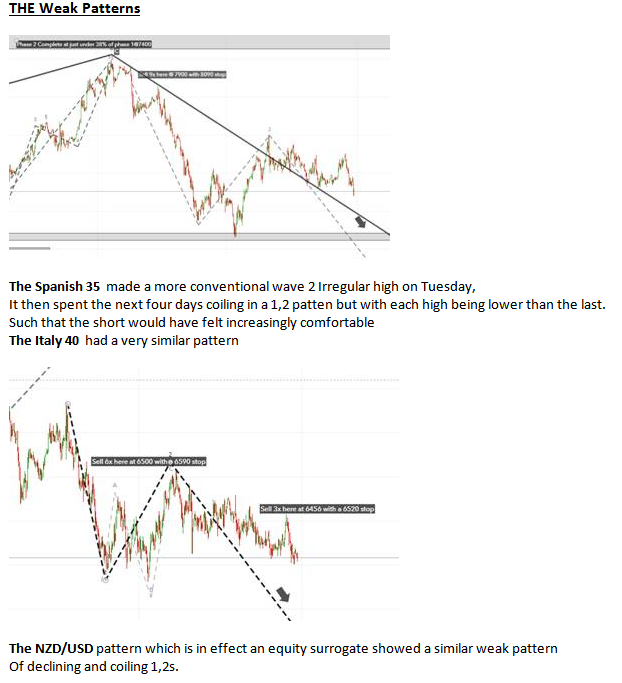
8.Special Feature last week's subtle patterns exposed.
As a special feature, I have included the subtly of the pattern differentiation between markets that helped me better predict the short term reversal points and rate the relative strengths of each market.
Image
Image
Macro Markets
This service is designed to provide long term and medium term investment outlooks in a range of markets including:
Equities
- Fang Index
- Nasdaq
- S&P 500
- Vix Volatility
- Dow Jones Industrial
- Russell 2000 Index
- DAX
- Euro Stoxx 50
- Eurovix Volatility
- FTSE 100
- FTSE 250
- FTSE 350 Travel
- Italy 40
- Spain 35
- China A50
- Hong Kong HS 50
- Japan 225
- Tawain Index
- Other DM Indices
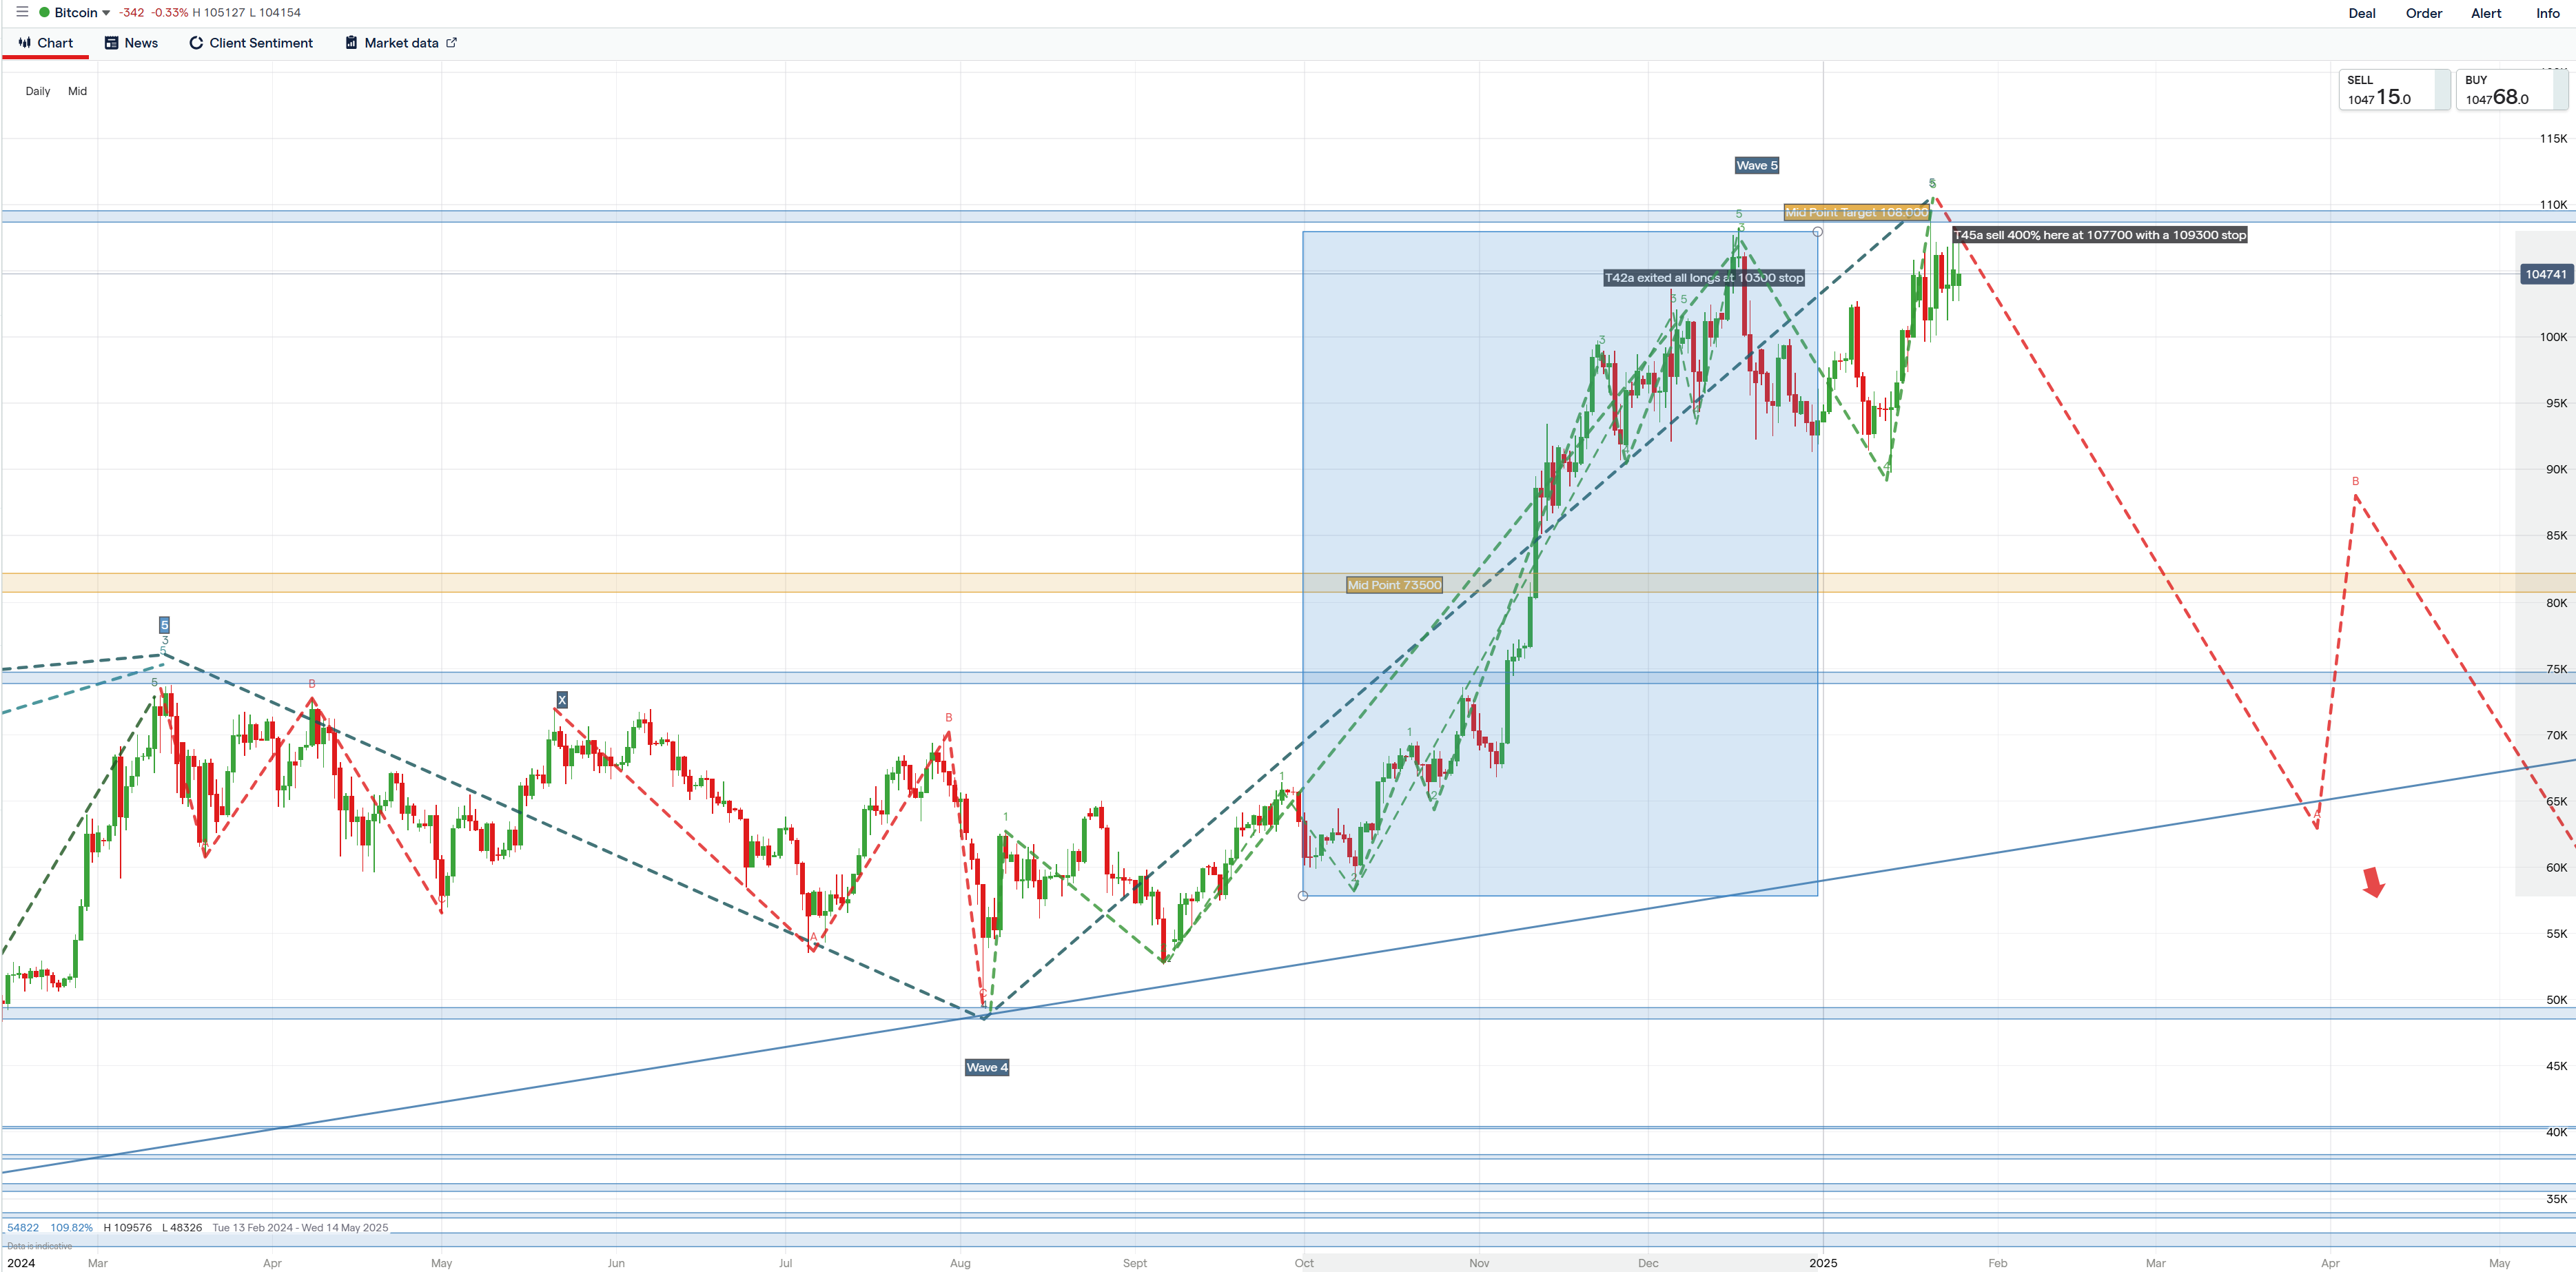
Crypto
- Ether
- Litecoin
- Bitcoin ($)
- Crypto 10 Index
FX
- Dollar Index
- Euro Krone
- Euro Dollar
- Euro Yen
- Dollar Swiss
- Dollar Yen
- Dollar Yuan
- Dollar Canada
- Dollar Krone
- Sterling (Cable)
- Sterling Euro
- Sterling Yen
- Dollar NZD
- AUD/USD
- AUD/NZD
- EM Currencies
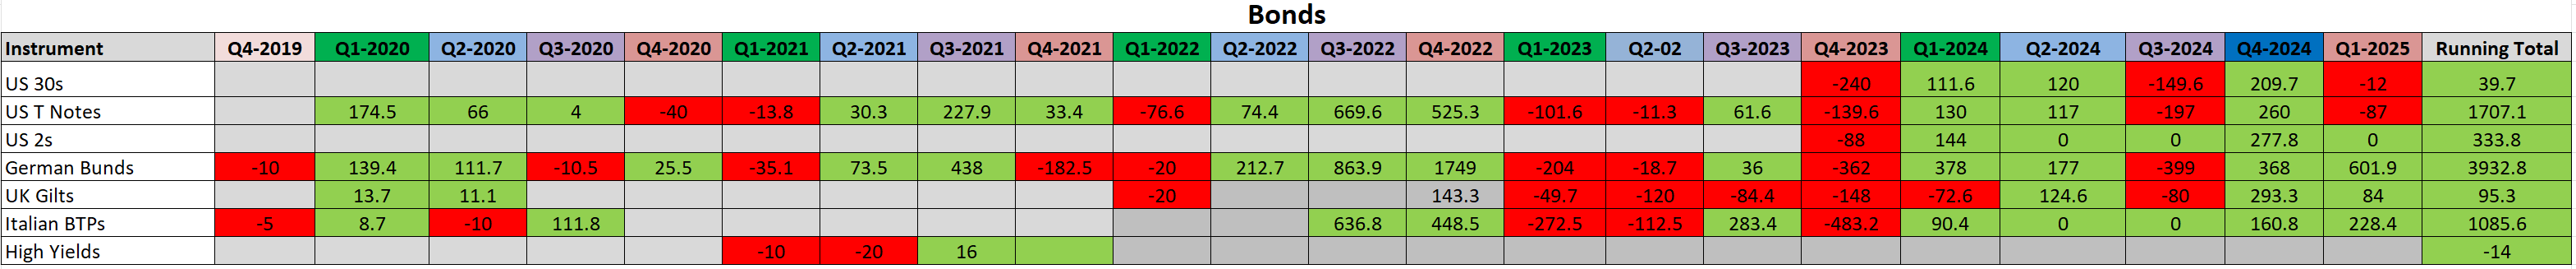
Bonds
- US 2 Year Note
- Bonos
- Bobl
- US 10 Year Note
- Bunds
- UK Gilts
- Italian BtB
- EU
- High Yield Credit
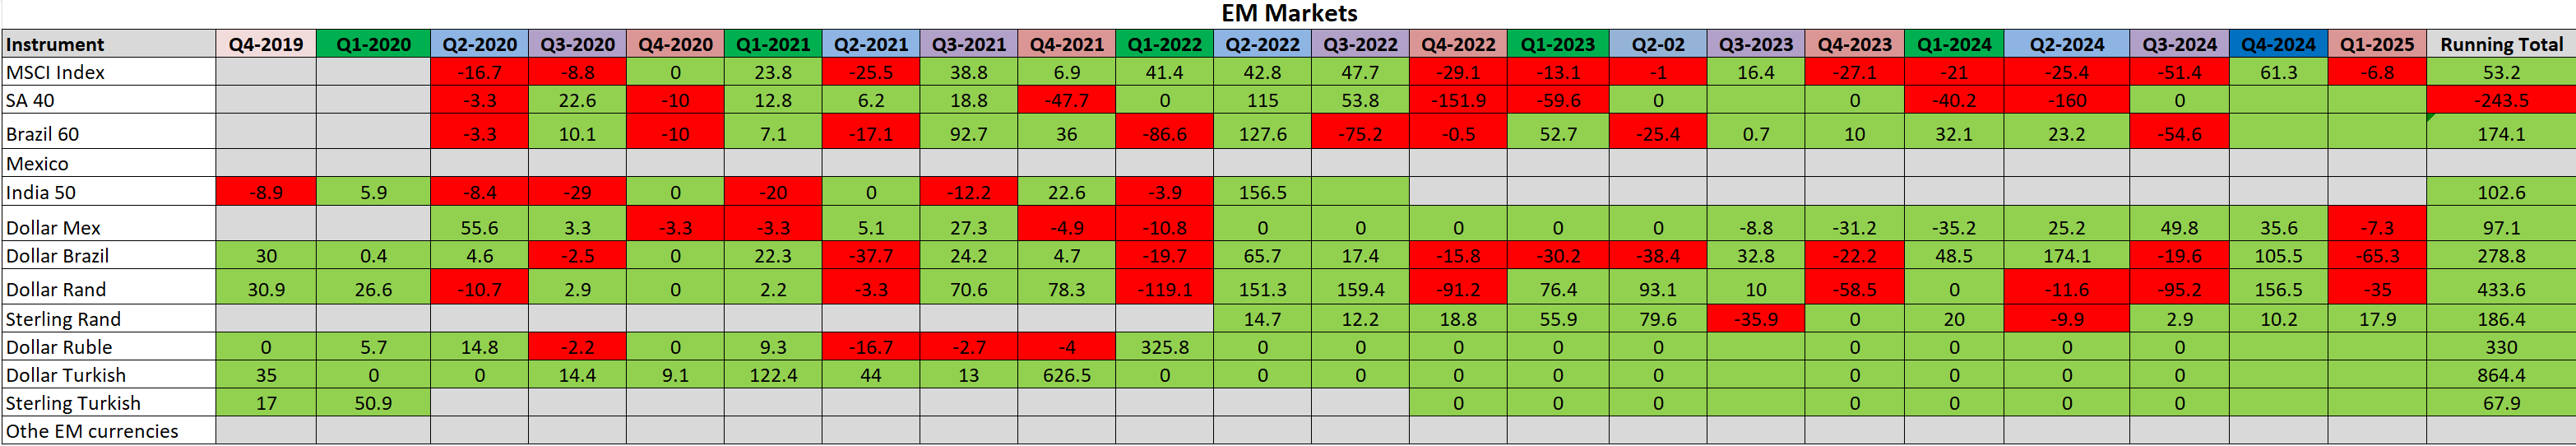
Emerging Markets
- MSCI Index
- South Africa 40
- Brazil 60
- India 50
- Other EM Indices
- Dollar/Mex
- Dollar/Brazil
- Dollar/Rand
- Dollar Ruble
- Dollar Turkish
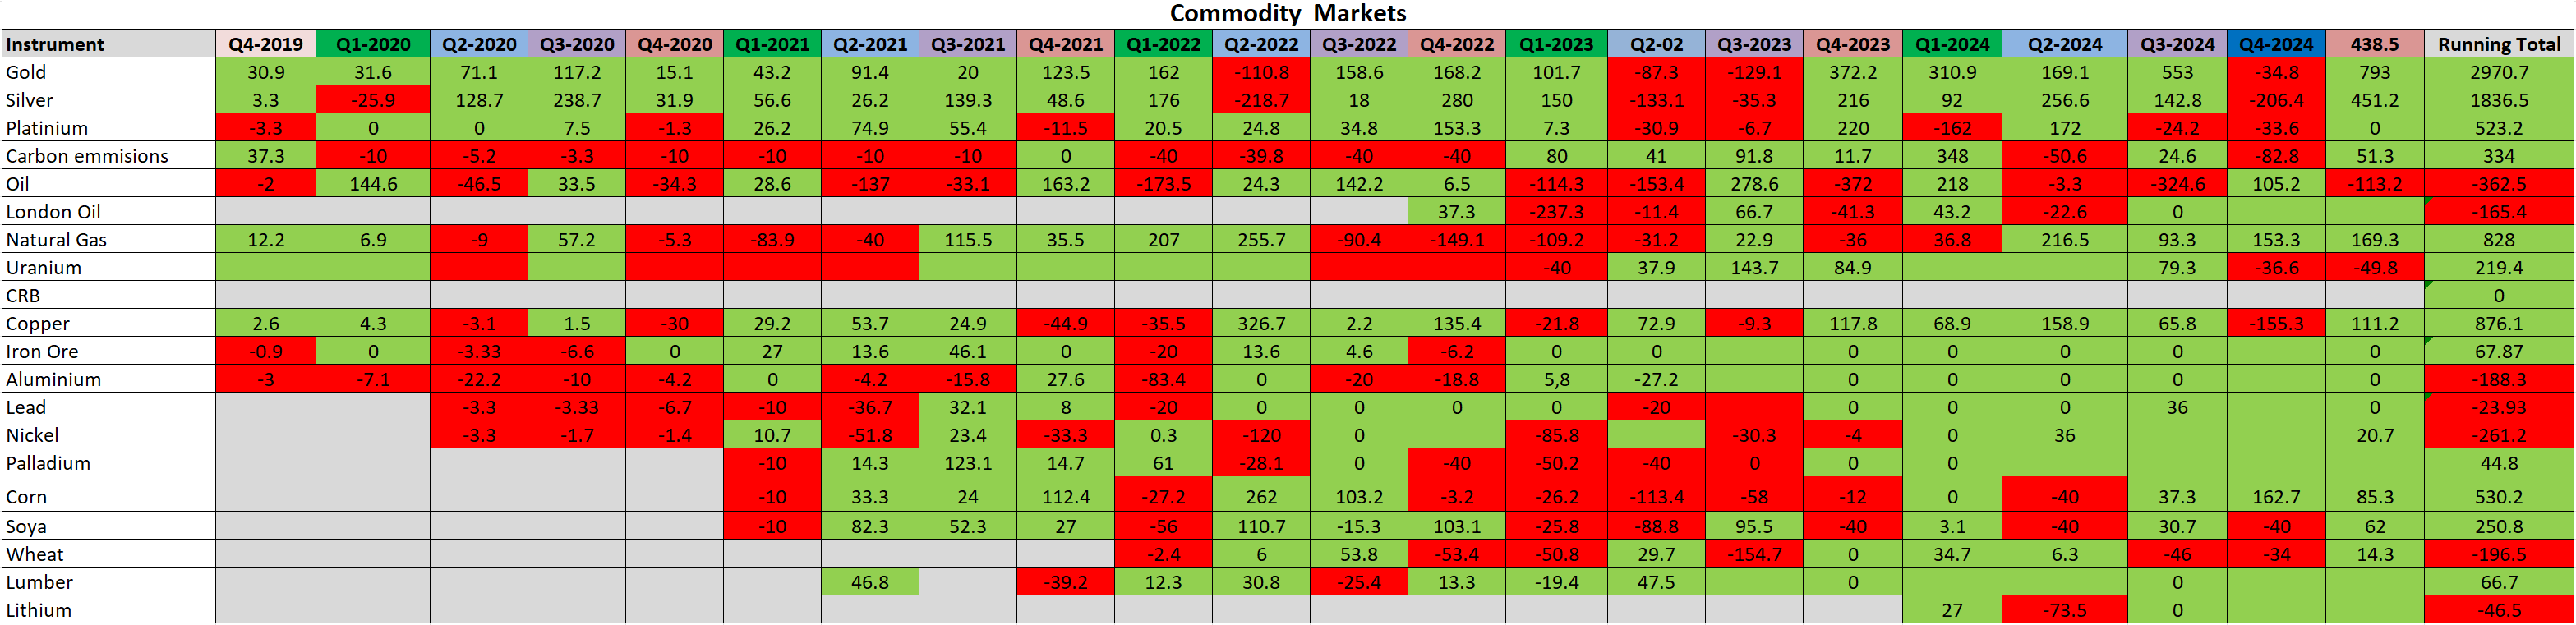
Commodities
- Silver
- Platinum
- Palladium
- Carbon Emissions
- Oil
- Natural Gas
- London Gas Oil
- CRB
- Copper
- Iron Ore
- Aluminium
- Lead
- Nickel
- Uranium
- Lumber
- Corn
- Soya Beans
- Wheat
Those marked in bold are more frequently updated.
Sample Executions
Below one indices is shown from each of the six sectors covered. Click on an indices or use the arrows provided to view each slide.
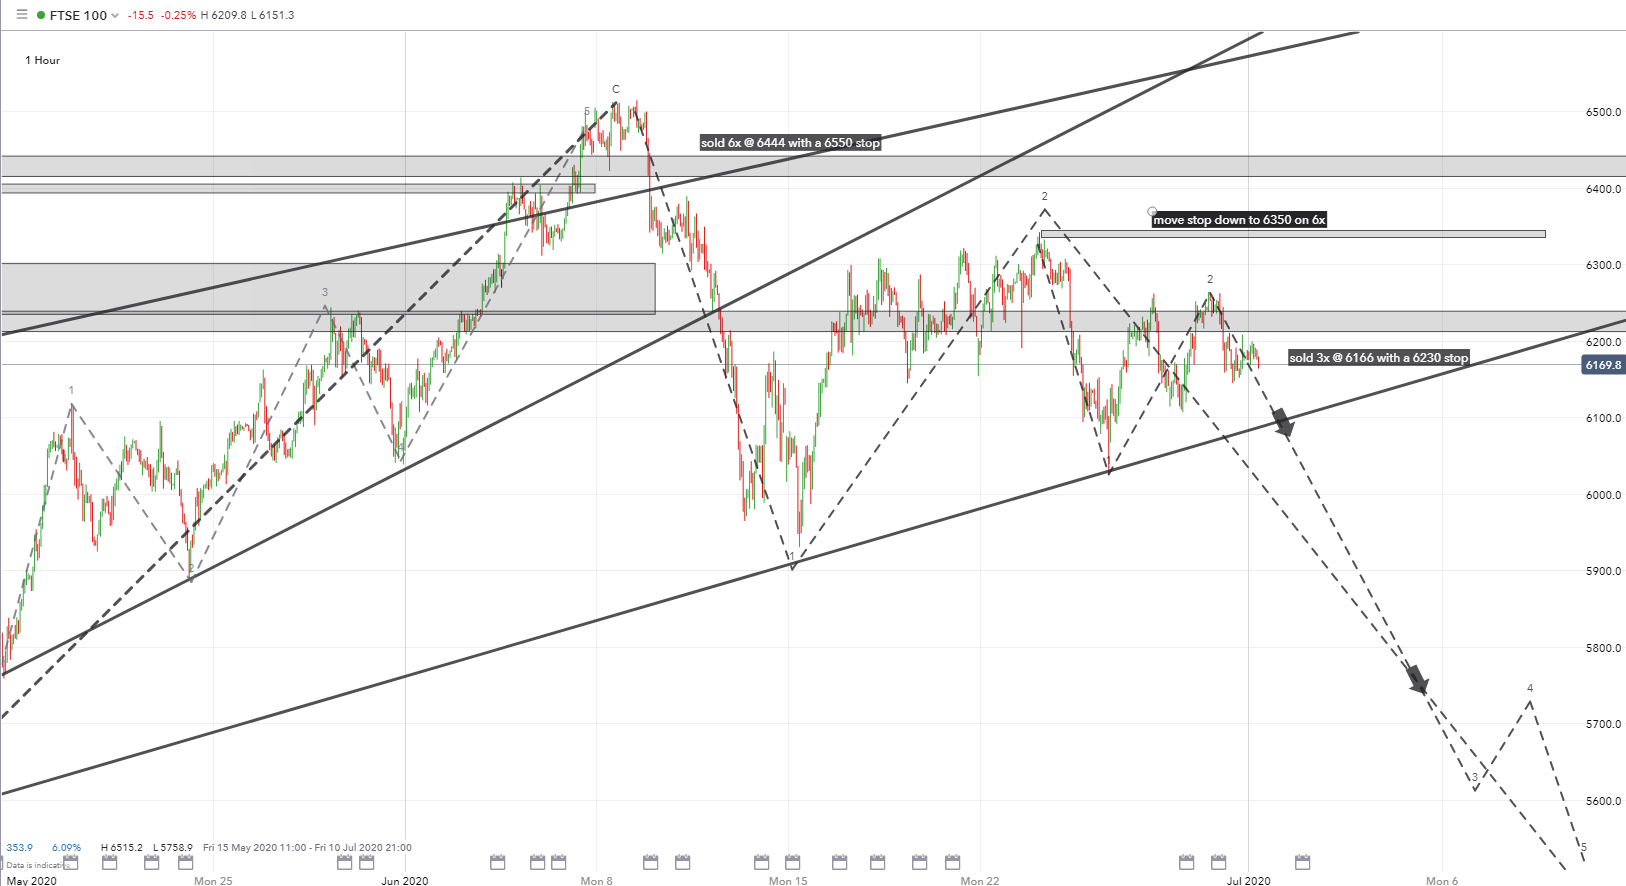
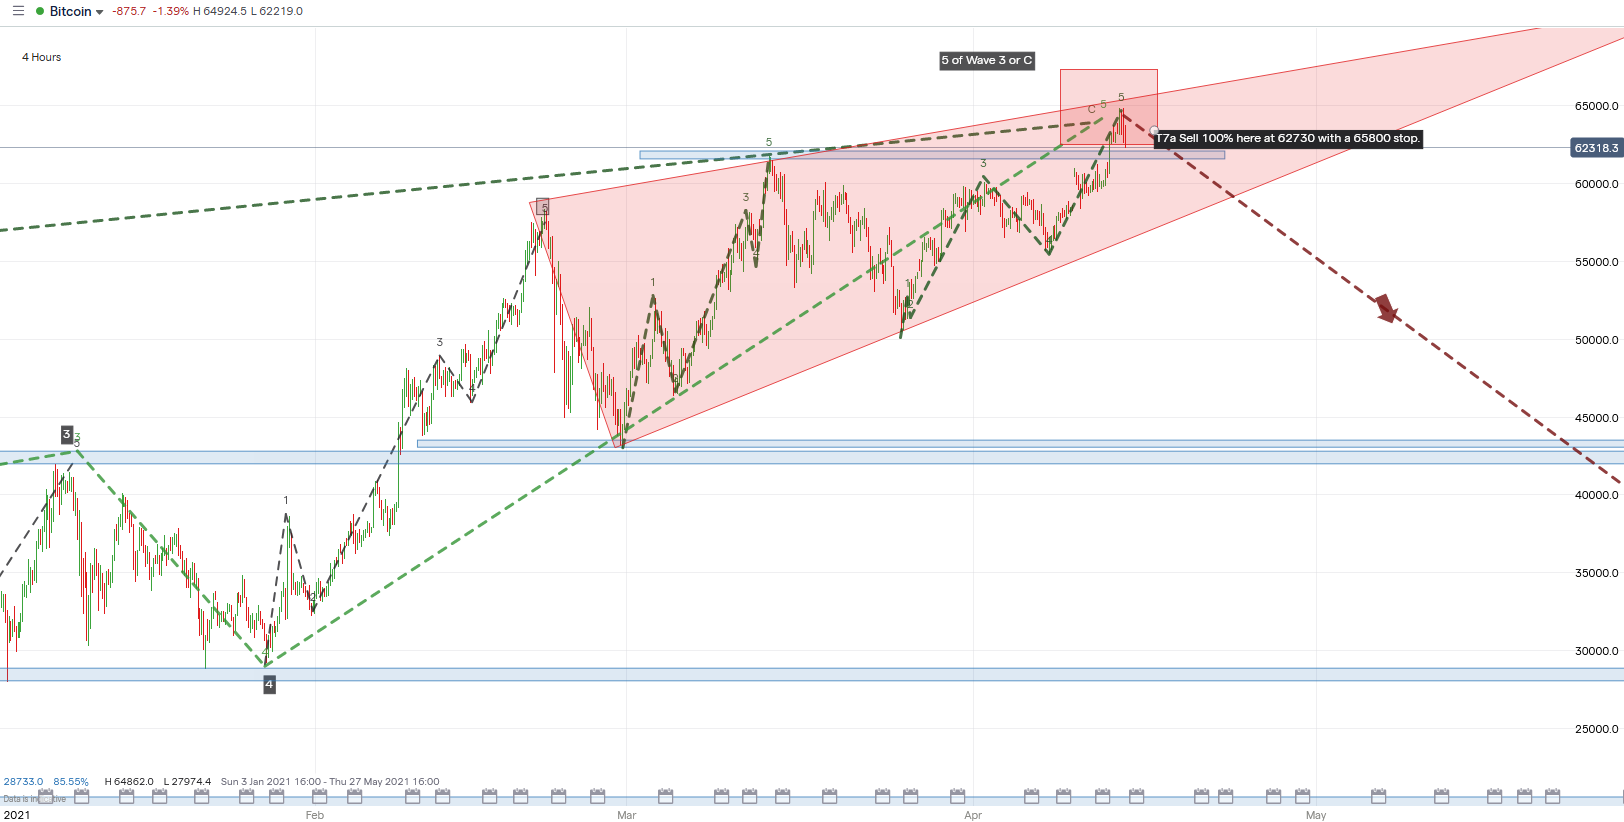 Bitcoin has been tracing out what we believe is a diagonal triangle that will reverse to the downside anytime soon, in a sharp break lower to 30,000.